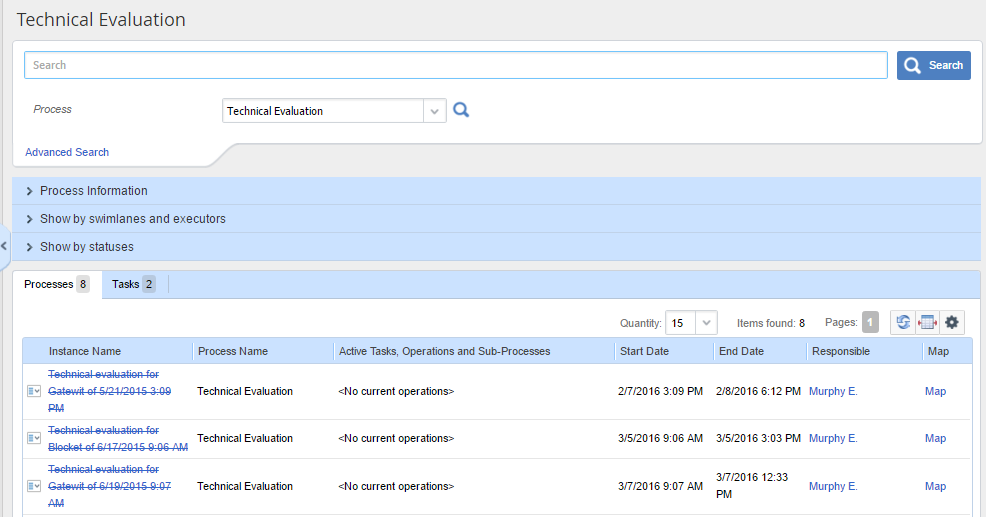
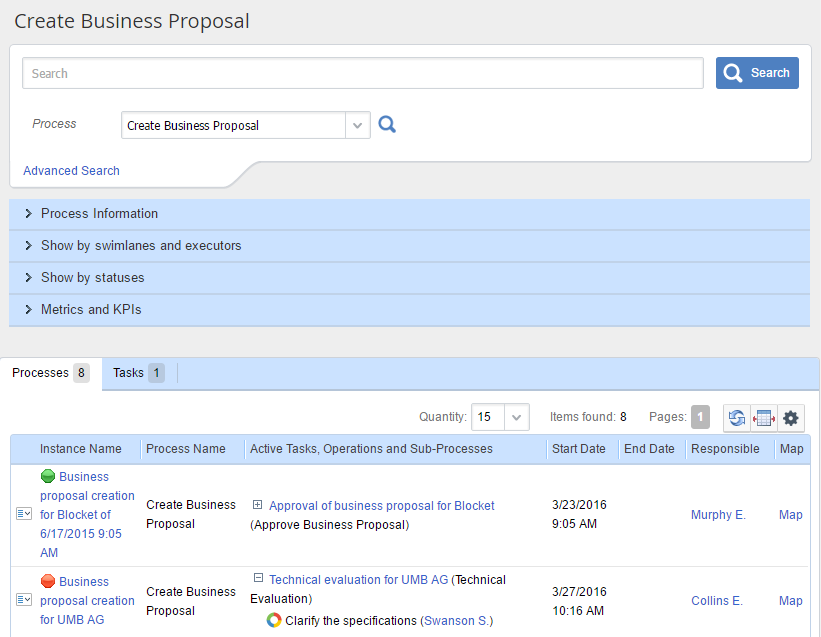
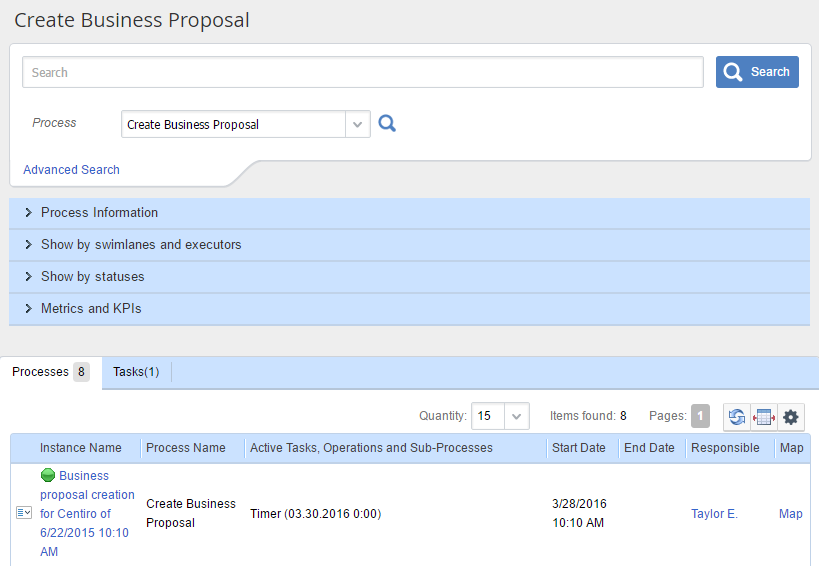
Process monitor page shows information on all the instances of the selected process (Fig. 1).
Fig. 1. Process monitoring page.
The page contains the following information:
Name of the process is displayed in the header of the page. The example of this page (Fig. 1) displays the "Technical Evaluation" process.
Quick and advanced search forms, that allows users to search process instances using specific criteria.
There are also three sections displayed as collapsible panels, that contain process information. Click on the name of the panel to expand or collapse the content:
At the bottom of the page there is a table with a list of all active process instances and current tasks related to these instances. The table shows filter results - results of the quick and advanced searches. Clicking on blue digits located in "Show by swimlanes and executors" and "Show by statuses" sections will also allow you to see these results.
Process information
This section contains general information such as (Fig. 2):
Clicking the Map link will open the process map in a new browser tab.
Clicking the Documentation link will open related process documentation in a new browser tab.
Published, Created, Owner and Supervisors fields show surname and initials of the users or the name of the user group. Clicking on the surname of a user opens a window with information about this user. Clicking on the group name will open the user group page, where you can change the group members. To do this you have to have permissions to manage user groups. Thus, if you do not have appropriate permissions, instead of the editing box you will see a warning message. An administrator can grant these permissions in Administration – Access Settings – Global Access Settings – Administration – Users Administration.
Fig. 2. Process monitoring page. “Process information”.
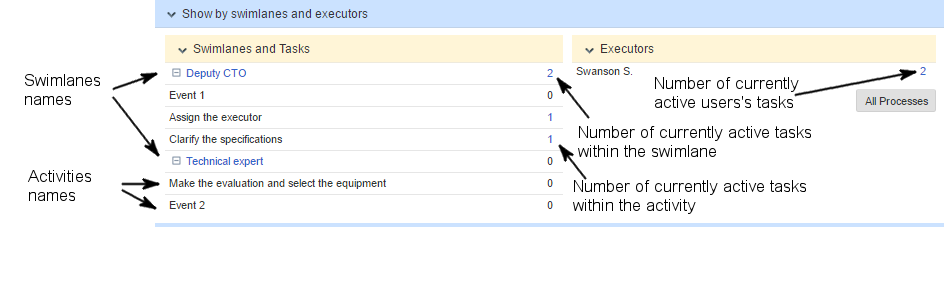
Show by swimlanes and executors
This section (Fig. 3) displays:
Swimlanes and the number of active tasks within each of them;
task executors and number of active tasks within each of them.
Fig. 3. Process monitoring page. “Show by swimlanes and executors” section.
Clicking on the name of a swimlane or on the icons "+" or "-" next to it, will expand or collapse the content.
The expanded list shows the activities that are within the swimlane (according to process model). Next to each operation there is a digit that indicates the number of currently active tasks.
Clicking on the digit that indicates the number of tasks within the swimlane, will open the list of process instances. This list will appear at the bottom of the Processes tab (Fig.1) and will show those that are active at the moment. The Tasks tab will display the list of currently active tasks.
If you click All processes, it will display the list of all the current instances and their tasks.
The Executors field shows the list of users who execute the task, and the number of tasks for each user. Clicking on the digit will open a task list at the bottom of the page.
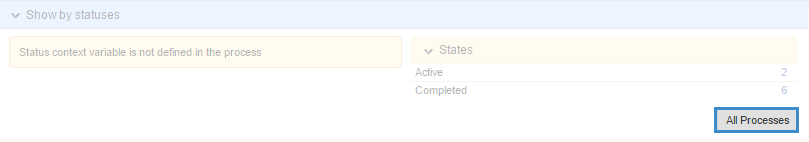
Show by statuses
This section (Fig. 4) displays the information on the number of process instances, that are in a certain status and condition.
Fig. 4. Process monitoring page. “Show by statuses” section.
Process statuses are defined in Designer individually for each process.
Processes can have one of the following states:
"Active" - current process instances.
"Completed" - completed process instance.
"Interrupted" - process instance, that was stopped by the process owner or any other user that has appropriate permissions.
Clicking on the blue numbers next to statuses or states will allow you to sort the data in the table.
If you click the All processes button it will display the list of all active process instances and tasks within each of them.
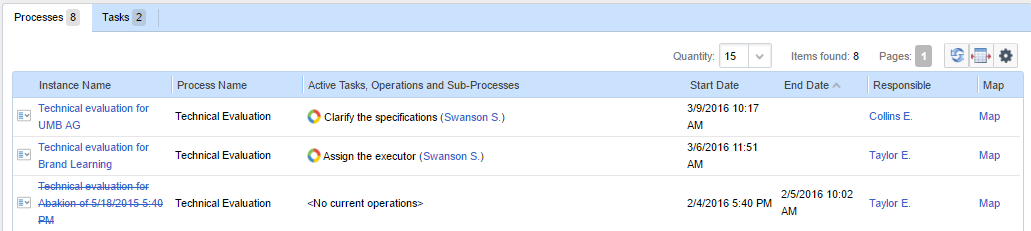
List of all active process instances and tasks
List of active instances and tasks on the process monitoring page (Fig. 5) is similar to the list, displayed on the process page.
Fig. 5. Process monitoring page. List of active instances and tasks.
You can export the filtered list of processes to an Excel file. To do so, click on the table settings panel.