Before making a modeled process available for work in Web Application, you have to make sure that it works as expected. ELMA BPM Platform has two tools, which allow you to check how a process works:
-
Process Checking allows you to check the process for logic errors. This tools checks if the process can be executed, but it does not check the semantics, the flow and the results of process activities with different values of context variables.
-
Process Debugging means examining how the process works with different values of the context variables. You can debug a process only after it has been checked.
Process debugging requires:
-
-
-
-
-
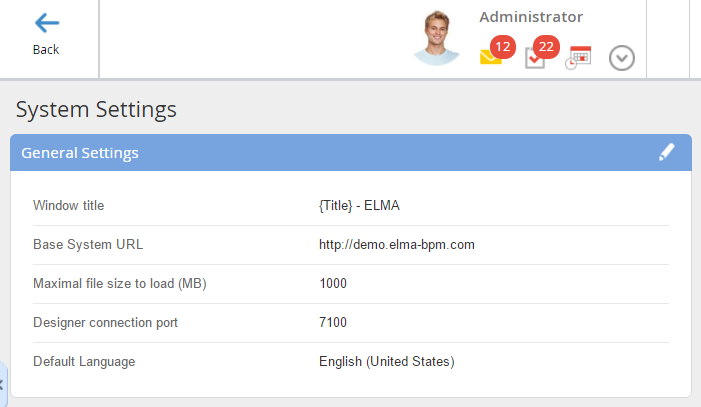
Base System URL specified in the general system settings, indicating the connection port of ELMA Web Application (Fig. 1).
|
|
|
Fig. 1. System Settings. General Settings
|
Debugging is started in ELMA Designer and is carried out in Web Application.
You can debug the entire process or start from a specific activity.
The debugging page opens in the default browser of your computer. If you are not signed in to Web Application, sign in before debugging. Use the same login as for ELMA Designer.
To debug a process, users must belong to one of the following groups: "Access to ELMA Designer" (these users have access to ELMA Designer) and "Administration" (these users have the system administrator access permissions).
Only one process can be debugged at a time. When a process is being debugged, you cannot work in ELMA in the same browser.
During debugging, process instances are created in ELMA. They are stored in the process history, but are distinguished as emulated, so they can easily be told apart from the working process instances. You can find these process instances in Full Process Monitor. Tick the Emulation checkbox in the Advanced Search field and then click Find.
In the debug mode, all the tasks are assigned to the user who initiated the debugging process. This allows the user to complete all the process tasks and examine every stage of the process.
Start Debugging
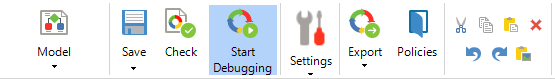
To debug the process from the start, click the Start Debugging button in the toolbar of the process page (Fig. 2).
|
|
|
Fig. 2. Start Debugging button for debugging from the start
|
Debugging from a specific activity
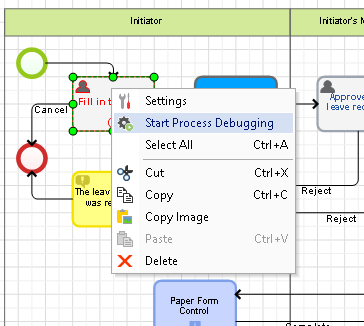
To start debugging a process from a specific activity, open the context menu of the activity and click Start Process Debugging (Fig. 3).
|
|
|
Fig. 3. Start Process Debugging option in the context menu of an activity.
|
Starting debugging in Web Application
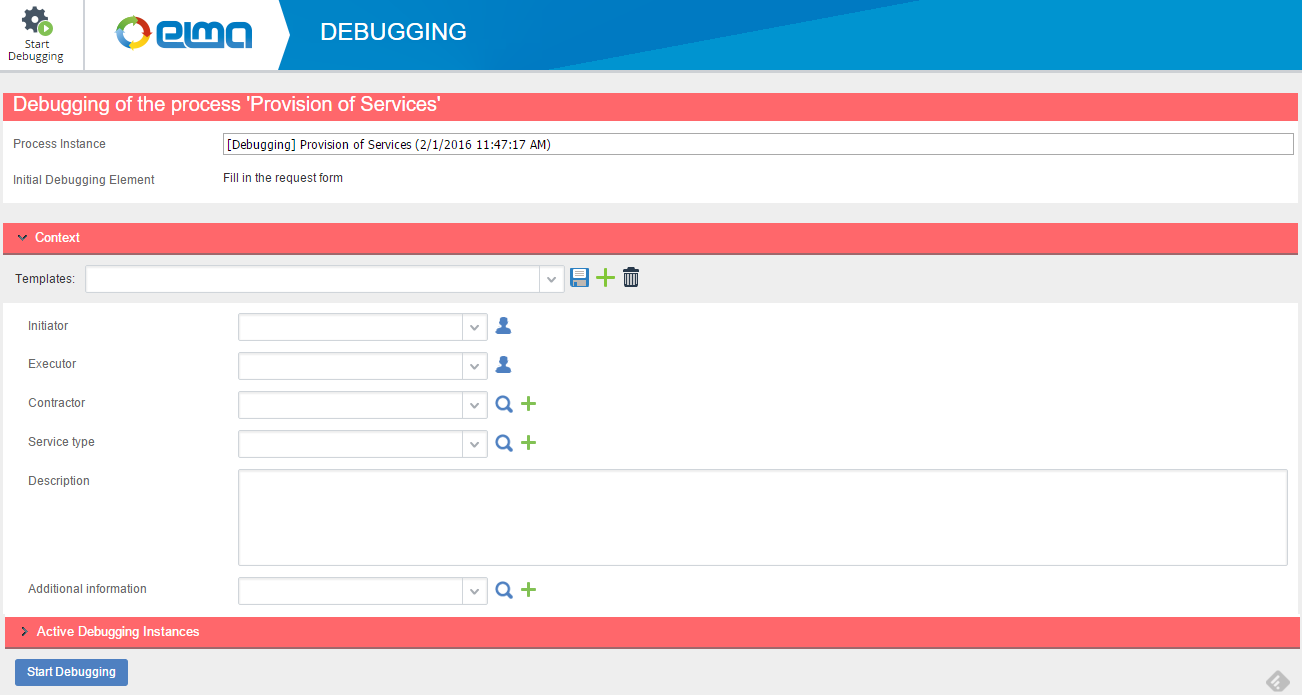
When you start debugging, the debugging form opens in a new tab or window of your browser (Fig. 4).
At this point, debugging hasn't yet started and no changes have been made in the system and the database. You can close the tab, it will not affect the system and the database.
|
|
|
Fig. 4. Debugging start form.
|
In the Process Instance filed, specify the name of the process instance. By default, this name is generated by template, which contains the [emulation] prefix, the process name, and a postfix, which specifies the date and time of debugging. During debugging, process instances are created in ELMA. They are stored in the process history. You can find these process instances in Full Process Monitor. Tick the Emulation checkbox in the Advanced Search field and then click Find.
Initial Debugging Element is the name of the activity, which was selected as the start point for debugging:
The Context section displays all the context variables of a process. You can fill in the properties that you want (all the properties can be filled in regardless at what process stage they are actually required) and start debugging.
At the top of this section you will find the Templates field. It allows you to manage templates.
You can save sets of pre-filled variables in templates and use them for debugging in the future. This way you do not need to fill in all the properties each time you debug with the same context variable values.
Fill in the values and click Start Debugging either in the toolbar or at the bottom of the page (Fig. 4).
Context process variables
A template is a defined and saved set of values of the process context variables. The template managing field is located at the top of the Context section.
|
|
In this field you enter the template's name. If you start typing the name or click on the small arrow on the righ-hand side of the field, you will see a list of existing templates. If you select one of them, the context will automatically adopt all the values saved in this template.
|
|
|
This button saves the current values into the selected template.
|
|
|
This button adds a new template with preset values of context variables.
|
|
|
Delete the previously saved template selected in the template's name field.
|
|
Attention!
If in the context of a process there is a variable of the Block type, the Template field will not be displayed.
|
Adding a template for context variables
After you have filled in the variables, save them to a new template. There are two ways to do it:
-
-
click the save button. This option works if there is no template specified in the name field.
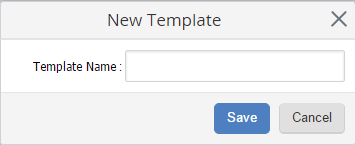
In both cases, after you click the button, the New Template window pops up. In this window you can enter the name of the template (Fig. 5). After you enter the new name, click Save. ELMA does not check the uniqueness of template names, so you can create two or more templates with the same name.
|
|
|
Fig. 5. New Template pop-up window.
|
Saving the template
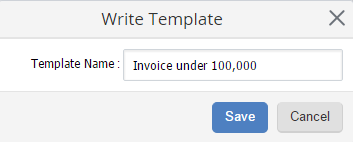
If you want to save a new set of values to an existing template, select the template in the name field, then enter the new values and click the save button. The Write Template window will pop up (Fig. 6).
|
|
|
Fig. 6. Write Template pop-up window".
|
Here you can change the name of the template and save the template with the new values and new name. Or you can leave the old name and rewrite only the values.
Debugging mode in Web Application
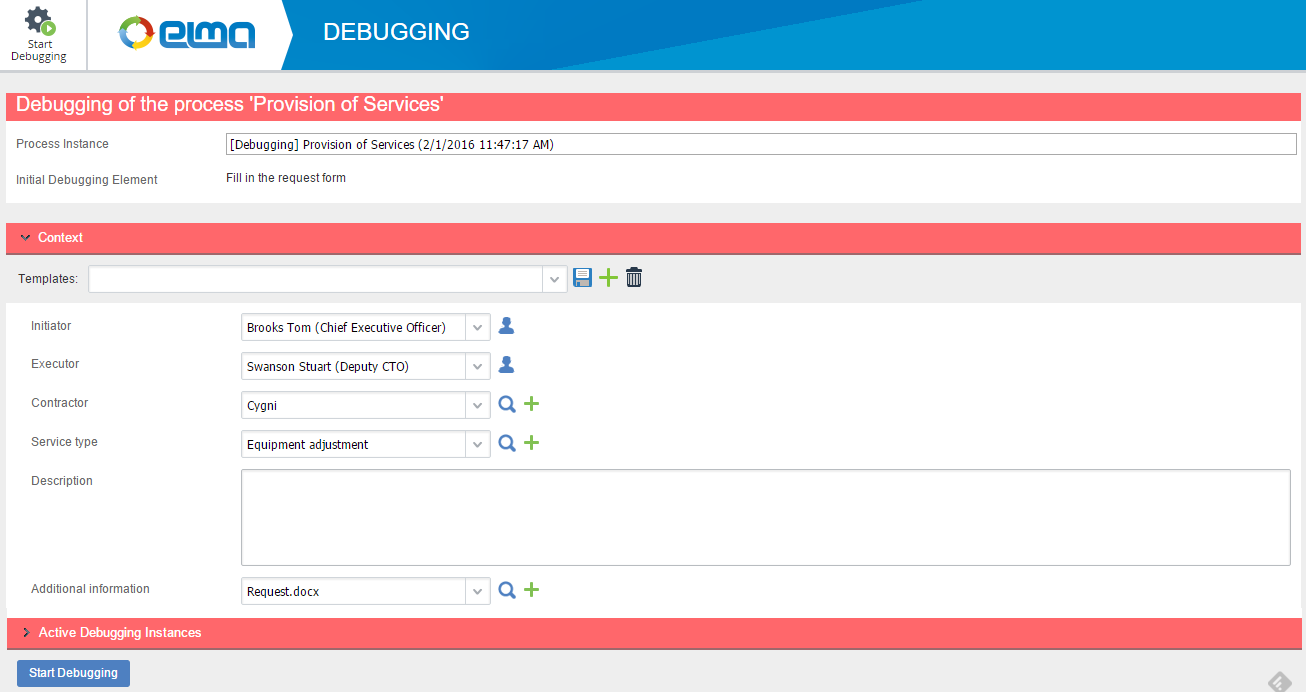
Enter the name of the process instance. Fill in the desired properties and click Start Debugging at the bottom of the form or in the toolbar (Fig. 7).
|
|
|
Fig. 7. Debugging start form with filled in properties.
|
The filled in variables will be used for emulation, but you will be able to change them manually in the course of the process or within a certain activity, where they are needed.
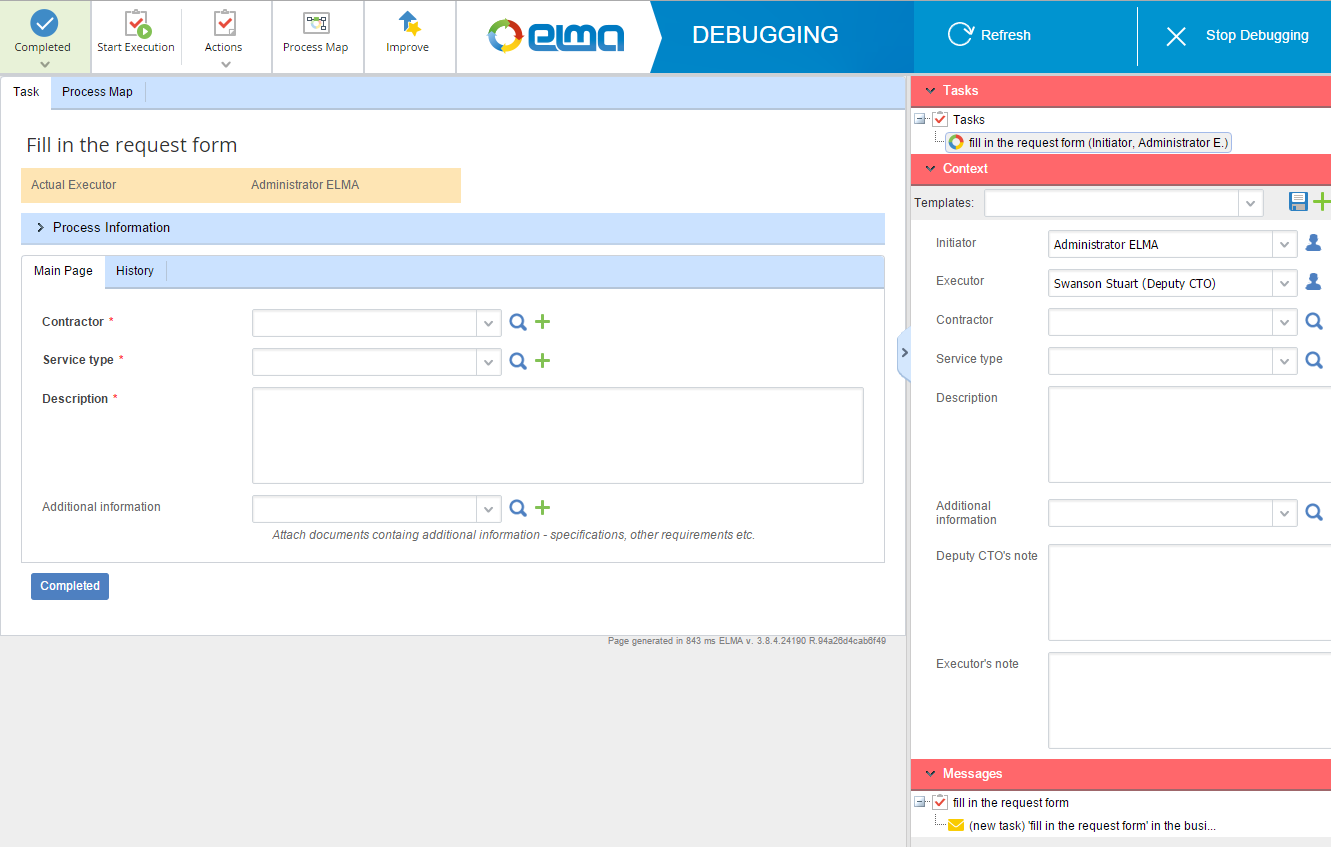
When you click the Start Debugging button, the debugging form opens (Fig. 8).
On the left-hand side you will see the form of the current task, similar to the user task form in Web Application. On the right-hand side you can see the debugging control features.
The Tasks section lists all the current tasks of the process. If at the present moment there are several active tasks, you can switch between them. To do so, click on the names of the tasks.
The initial values of the variables that belong to the process context are featured on the left. They are specified at process start or generated by template. These values can be changed in the course of the process, if required by the process activity.
On the right-hand side of the Context section you can change the current values of the context variables. To save these changes, click Refresh in the top right corner of the page. The new values will be used in the process until they are changed again in the Context section or in a process activity.
Debug completion
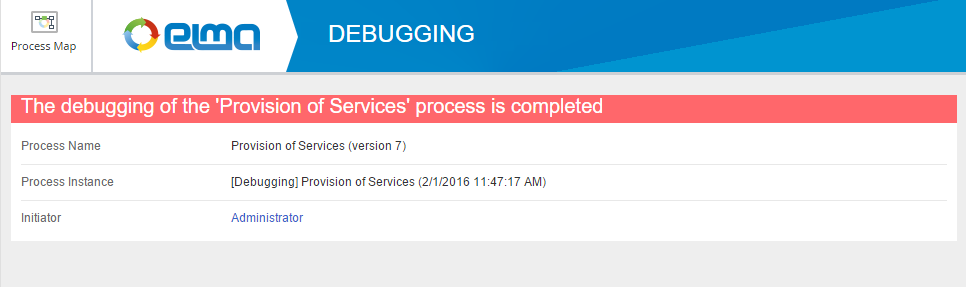
You can stop debugging at any moment. Click Stop Debugging in the top right corner of the debugging page (Fig. 8). A page with debugging results will open (Fig.9).
|
|
|
Fig. 9. Results of debugging.
|
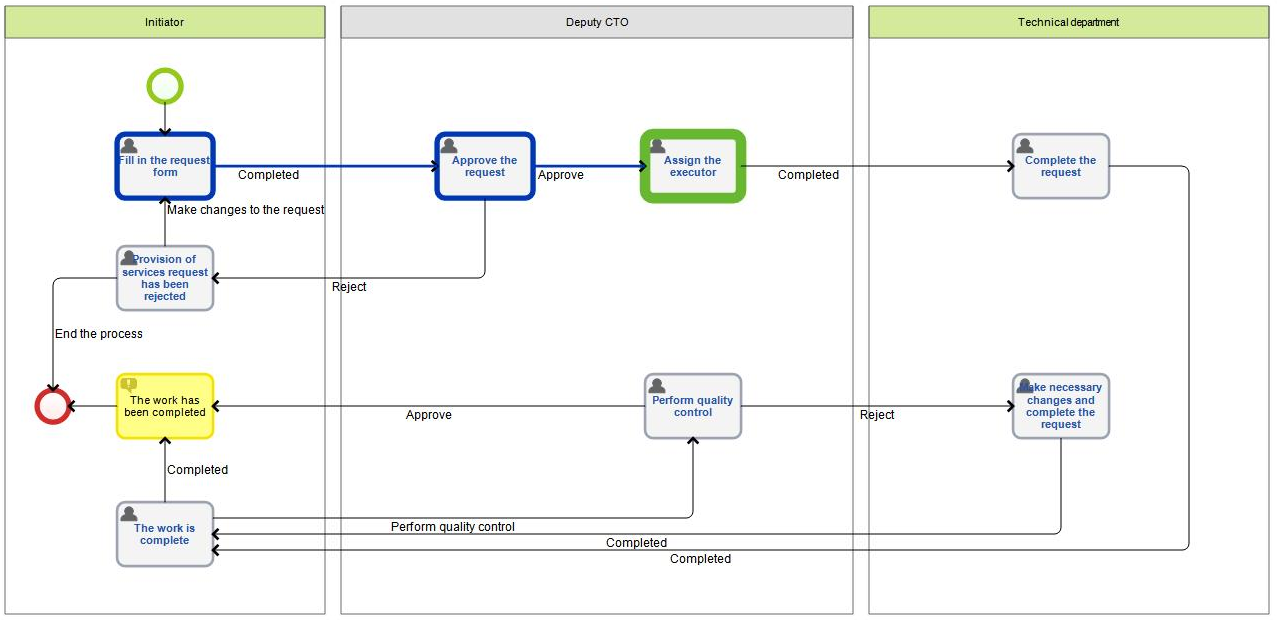
The Process Map button in the top left corner of the screen opens the process map, which shows the current activity of the process (Fig. 10).
|
|
|
Fig. 10. Example of the process route within the debugging process.
|
Note
If you start the debugging process from a certain activity, which is located inside a parallel gateway, you can only debug the process flow that goes from that activity to the end point of the gateway. Debugging will stop once the flow reaches the closing gateway. It will not go further because the gateway settings are not satisfied.
Copyright © 2006–2019 ELMA