The Diagram portlet can show the values of a process KPIs or metrics for a certain number of periods.
KPI periods values are shown along a horizontal line of the diagram. KPI values are displayed vertically. Periods are counted from the current date. The number of periods on the diagram can be defined in portlet settings. The last period on the diagram is the current one.
For convenience of users the information on this portlet is continuously updated over a specified number of periods. Adding this portlet to a page of the Web Application will provide you with quick access to that information.
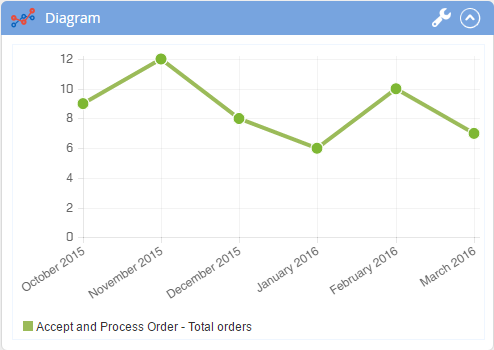
Fig. 1 illustrates "Total Orders" metric values over the last 6 months.
Fig. 1. "Diagram" portlet for the process metrics.
The header of the portlet can be changed in the portlet settings. It also contains the following buttons:
- the portlet is expanded. Clicking this button will collapse it.
- the portlet is collapsed. Clicking this button will expand it.
- portlet settings.
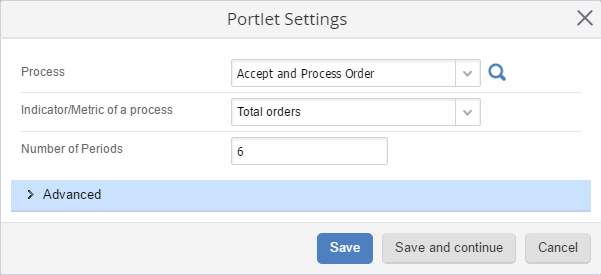
Features of the Diagram portlet (Fig. 2):
Process – select a KPI or metric, on which you want to see a diagram.