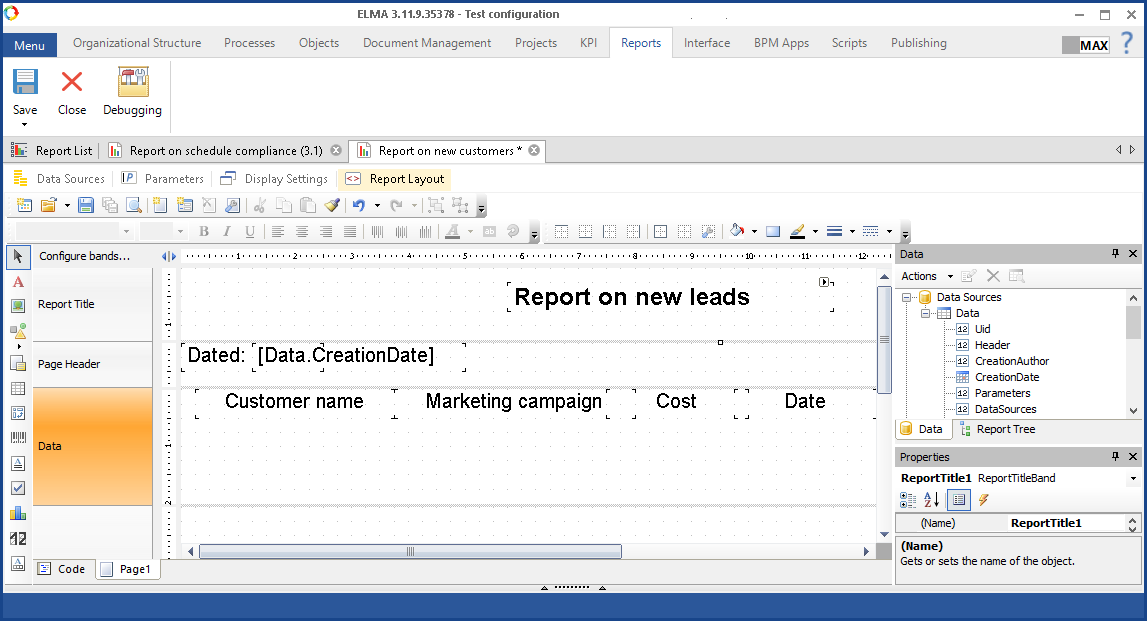
On this tab (fig. 1), you can configure the way the data will be displayed on the report page.
|
|
|
Fig. 1. "Report Layout" tab
|
By default, FastReport technology is used for creating a report layout in ELMA Designer. You can see the FastReport interface on the Report Layout tab. FastReport provides tools for developing the report layout and previewing it.
This tab consists of several areas:
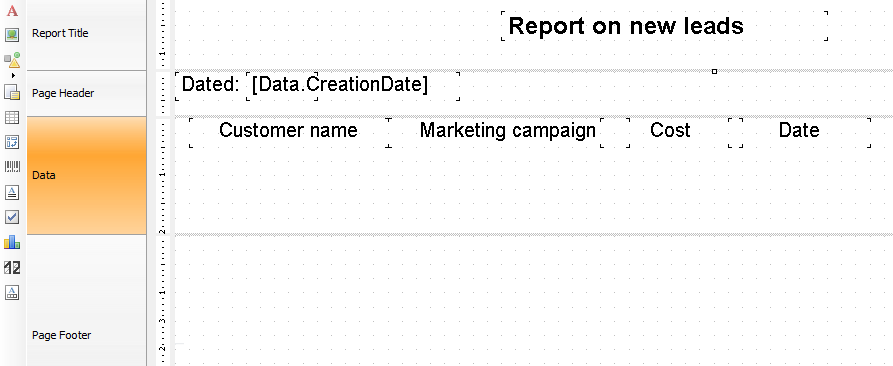
Layout Sheet
The layout sheet is divided into horizontal areas (fig. 2):
-
Report Title – this area contains the report title;
-
Page Header – this are contains the column names;
-
Data – data area, to which you can add elements from the data panel;
-
Page Footer – this area may contain various summary data (e.g. copyright, date, author).
You can change the size of the areas by stretching them.
You can add several cells to each of the sheet areas. You can configure the size (width and height) and the text generation in the cells using different toolbars. The design of the layout sheet will be displayed in the report in Web Application.
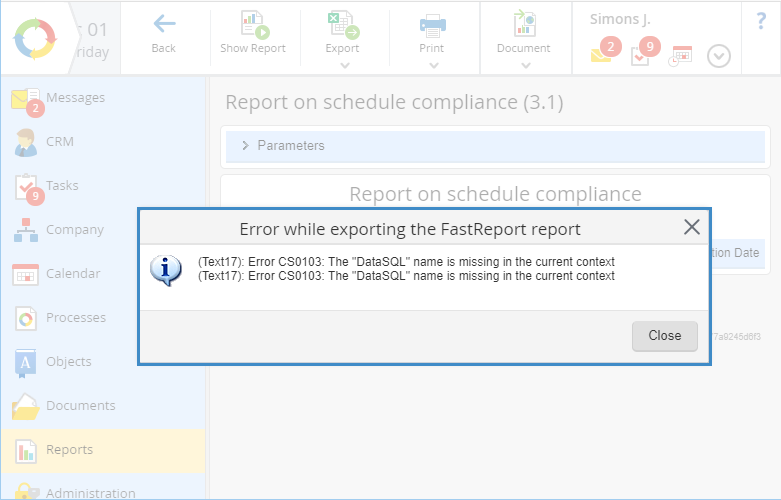
If there are errors in the page layout, you will see an error dialog box (fig. 3), when exporting the report in Web Application.
|
|
|
Fig. 3 Report page. Error dialog box.
|
Once the error is eliminated on the Layout tab of ELMA Designer, the report will be available for exporting in several formats. For more information about the available export formats, see the respective Help page
Report layout management panel
The report layout management panel (fig. 4) is below the report tabs, but you can move it to another place.
|
|
|
Fig 4. Report layout management panel
|
 – create new layout templates (empty report, child report, report wizard and so on) or report elements (new report page, new data source, new dialog form).
 – open a report layout form.
 – save the report layout as a .frx file.
 – save the report and its sub-reports.
 – preview the report.
 – create new report page.
 – create new dialog box.
 – delete the report page.
 – page settings: size and orientation, page fields, number of columns and so on.
 – standard buttons: cut, copy, paste, format painter, undo, redo.
 – group the selected objects.
 – ungroup the selected objects.
If necessary, you can change the set of buttons on this panel. To do so, click  and select/deselect the required buttons.
The text toolbar (fig. 5) is below the report layout management panel, but you can move it, if necessary. Active buttons on this panel are dark-yellow.
 – select the text font, size and style.
 – select the text alignment mode.
 – select the text colour.
 – select conditional formatting.
 – change text angle.
If necessary, you can change the set of buttons on this panel. To do so, click and select/deselect the required buttons.
The frame toolbar (fig. 6) is to the right of the text toolbar, but you can move it, if necessary. Active buttons are dark-yellow.
 – show/hide borders.
 – line settings (colour, width, style).
 – select the fill color.
 – select the fill style (color, gradient, and so on).
 – line colour, width and style.
If necessary, you can change the set of buttons on this panel. To do so, click and select/deselect the required buttons.
The report objects panel (fig. 7) is in the left part of the Report Layout tab; you cannot move it. Active buttons are dark-yellow.
To add an object to the layout sheet, click on the required object and on the spot to add it to.
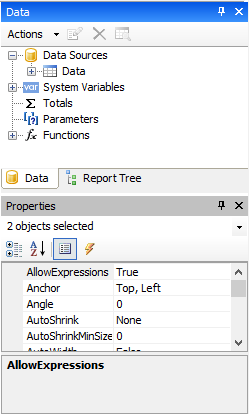
The data panel (fig. 8) is in the right part of the Report Layout tab. This panel includes two units: Data and Properties.
The Data unit displays the following data: data sources, created on the Data Sources tab, system variables, functions and the report tree. The data sources display the column and function names. To display them, open the data source by clicking  , to the left of the data source name.
The names and system variables can have the following icons (depending on their type):  – text;
  – number,
  – date.
You can add the column and function names and the system and mathematical functions to the the following areas of the layout sheet Data and Page Footer.
The Properties unit displays the properties of the selected data unit.
Copyright © 2006–2019 ELMA