You can configure the system diagnostics in Administration - System - System Diagnostics.
In this section you can configure logging of information on ELMA events, errors and productivity. This information is helpful for identifying the causes of the system failures and low efficiency. The information is also useful for the system security audit.
ELMA diagnostics means recording the diagnostics data to:
-
ELMA performance reports;
-
-
Windows performance counter.
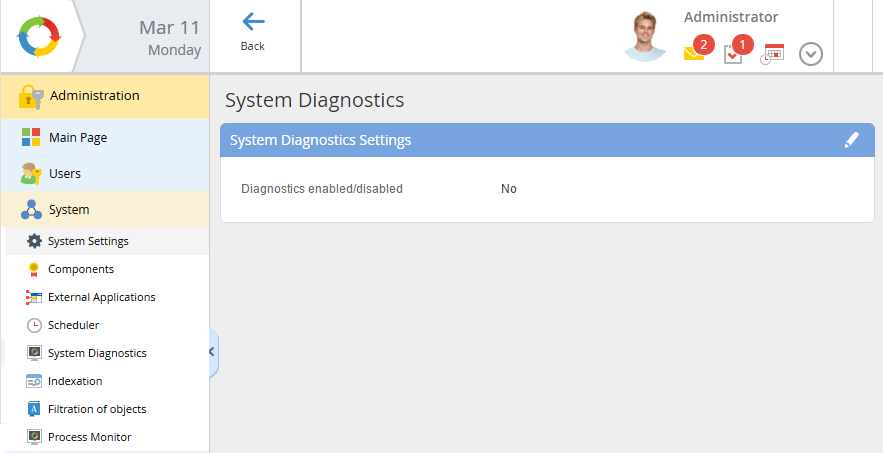
By default, the system diagnostics is disabled. To enable diagnostics and change the data recording parameters, click  (fig. 1).
|
|
|
Fig. 1. Administration - System - System Diagnostics.
|
System Diagnostics Settings
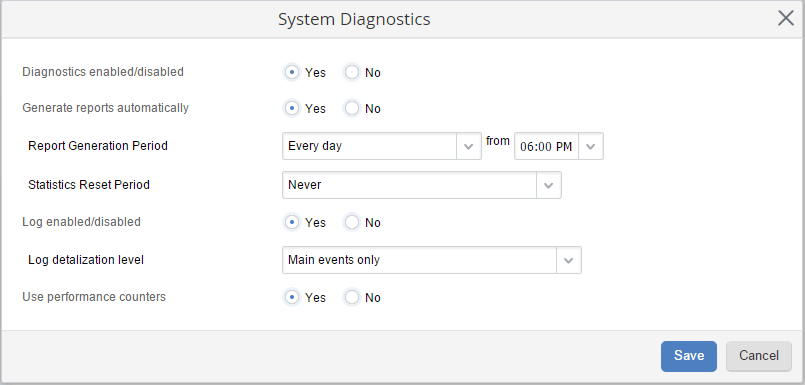
To open the system diagnostics window, click in Administration - System - System Diagnostics (fig. 2). Here you can configure the parameters for generating and recording data on events, errors, and performance of ELMA.
|
|
|
Fig. 2. System diagnostics settings.
|
Diagnostics enabled/disabled allows enabling/disabling logging of performance diagnostics data. Note, that if you enable diagnostics, it may decrease the system performance and require additional disk space.
Generate reports automatically automatically generate ELMA performance reports with the selected periodicity. Specify the reports generation period, the first report generation time and the statistics reset period.
Log enabled/disabled allows enabling/disabling recording detailed diagnostics data. Specify what the log will Include:
-
Errors only - log information on the system events, which completed with errors, and the errors information.
-
Main events only - log information on errors, user requests and background tasks, started by the scheduler or as part of a process instance.
-
All events - log information on all the requests, background tasks and invocations of the system core functions. This level requires significant system resources and a lot of disc space. We recommend to use this level only if the other two are not enough to identify the cause of failures.
Use performance counters enable/disable recording of the ELMA performance information to the Windows performance counters.
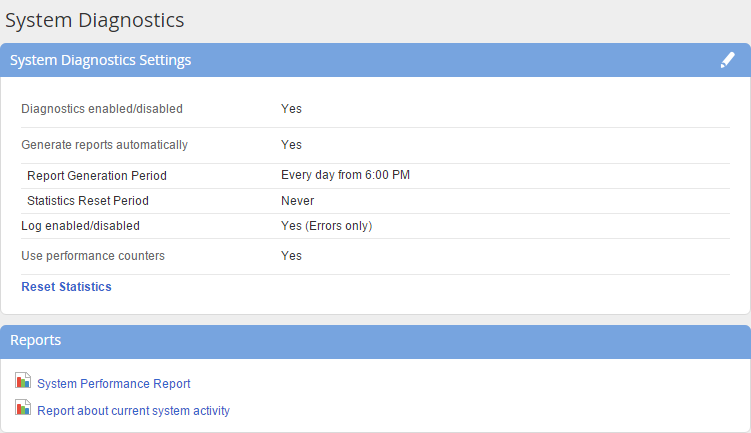
If the system diagnostics is enabled, the diagnostics page displays the current diagnostics settings and tools for working with the diagnostics information (fig. 3).
|
|
|
Fig. 3. Administration - System - System Diagnostics. Diagnostics Enabled.
|
The Reset Statistics button allows to clear the accumulated statistics.
Reports
The Reports unit contains the links for generating diagnostics reports:
-
Click System Performance Report to generate and download the system performance report since the last statistics reset;
-
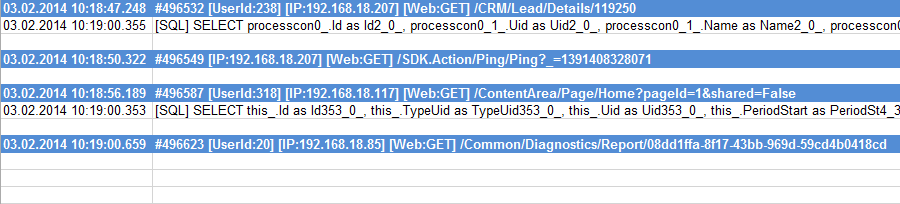
Click Report about current system activity to generate report on user requests, processed by the system at the moment. The report may be useful for evaluating the current system load and for auditing the system security. The report contains the request start time, its internal number, user ID, IP address, method type and the requested page.
System Performance Report can be generated automatically. Activate the Generate reports automatically switch and configure these settings:
|
|
Report generation period - how often the reports must be generated in the system. from - time, from which the reports must be generated.
|
|
|
Statistics Reset Period - the time interval, during which statistics must be accumulated:
-
Never - statistics will not be reset.
-
Every 24 hours after first reports export - statistics will be reset once every 24 hours. The reset time depends on the time, selected in the from field.
-
After every reports export - statistics will be reset every time after generating a report.
|
The report file name is generated by the template, which consists of the report ID, ELMA server machine name, report date and time. Performance report ID is ELMA_Performance, current system activity report ID - ELMA_Activity. An example of a performance report name:
ELMA_Performance_EN-DEMO_2016_01_15_17_17.xlsx:
-
ELMA_Performance - report ID;
-
-
2016_01_15 - date as year_month_day;
-
17_17 - time as hours_minutes;
-
xlslx - the MS Excel file extension.
The reports are saved to [ELMA installation folder]_Web_logs_Diagnostics_Reports on Windows.
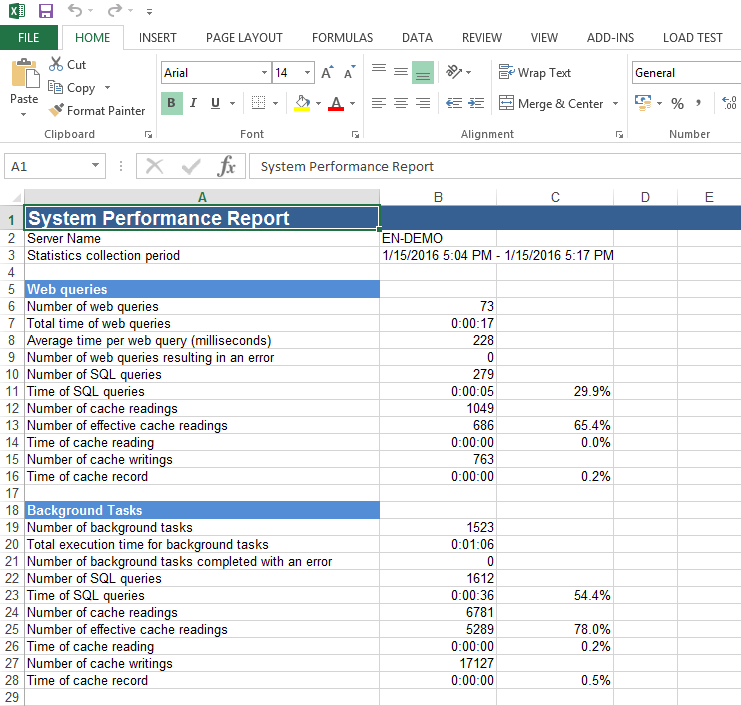
The system performance report contains general information on the system performance indicators, web queries, scripts, background tasks, SQL queries, objects and method invocations (fig. 4). Apart from that, this report displays a summary of the installed ELMA system (version number, build, edition), as well as data on DBMS, .Net Framework versions, etc. The information is displayed on the respective tabs.
|
|
|
Fig. 4. System performance report.
|
The current activity report contains the query start time, user ID, IP address, method type and the requested page. If the string does not contain the user ID, the query was initiated by ELMA (fig. 5).
|
|
|
Fig. 5. Current activity report.
|
Statistics Log
Statistics log - is a file with the detailed information on ELMA operation. The information detail level is defined by the diagnostics settings.
The file name looks like "diagnostics-[log creation date]". The log's data are not deleted by ELMA. A new log file is created for each day.
If diagnostics is disabled, these files are empty.
The log files are saved to [ELMA installation folder]_Web_logs_Diagnostics on Windows.
Performance Counters
If the performance is insufficient, you may need to analyse the situation and track the resource usage by applications or system processes in order to increase the system capacity. Windows performance counters are useful for this purpose. ELMA automatically creates three counters when activating the Use performance counters switch:
Average background tasks time - average time for executing background tasks, i.e. tasks, started by ELMA. Background tasks are described in Scheduler.
Average web request time - average time for executing web requests.
Database query count per time interval - number of SQL queries in a time interval. You can set the time interval by configuring the Windows counters.
To configure performance counters in Windows, go to Control Panel - Administrative Tools - Computer Management.
To add counters, go to Performance - Performance Monitor and click  (fig. 6). The diagram is drawn online by the values of the selected counters.
|
|
|
Fig. 6. ELMA system counters diagram.
|
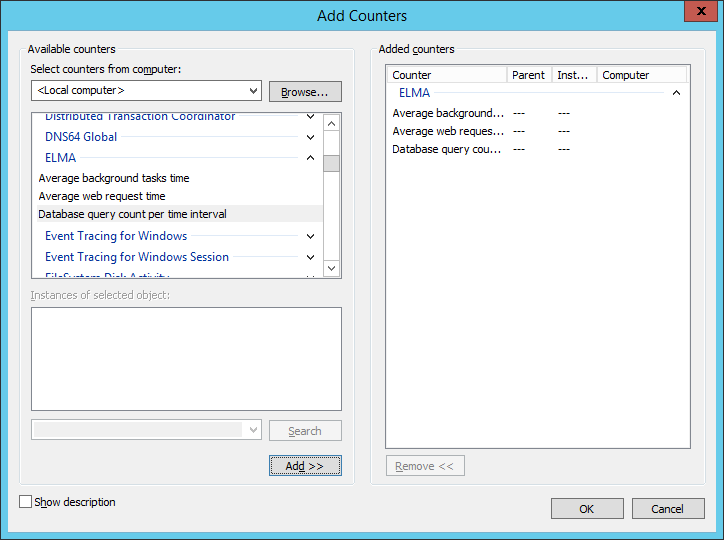
In the opened window (fig. 7) the Available counters unit displays all the counters in Windows. ELMA group displays the performance counters, recorded by ELMA server. To add counters to the system monitor, select them in the list and click  . The selected counters will be displayed in the Added counters unit. Click OK to return to the system monitor.
|
|
|
Fig. 7. Adding ELMA counters.
|
Copyright © 2006–2019 ELMA