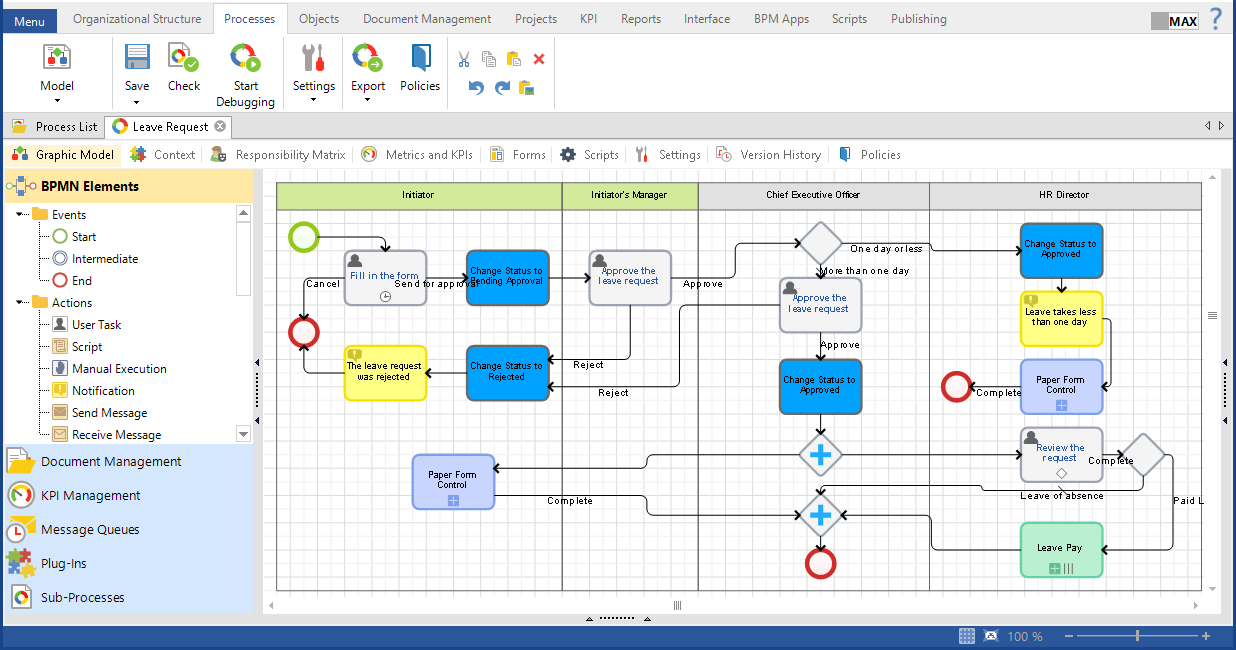
A graphic model is a visual diagram (map) which represents the entire process: the flow objects and the connectors between them.
ELMA uses a set of specialized graphical elements (Business Process Model and Notation) for process modeling. All the available elements are located on the side panel. The number of elements may vary depending on the installed system modules. Use drag-and-drop to design a process model.
|
|
|
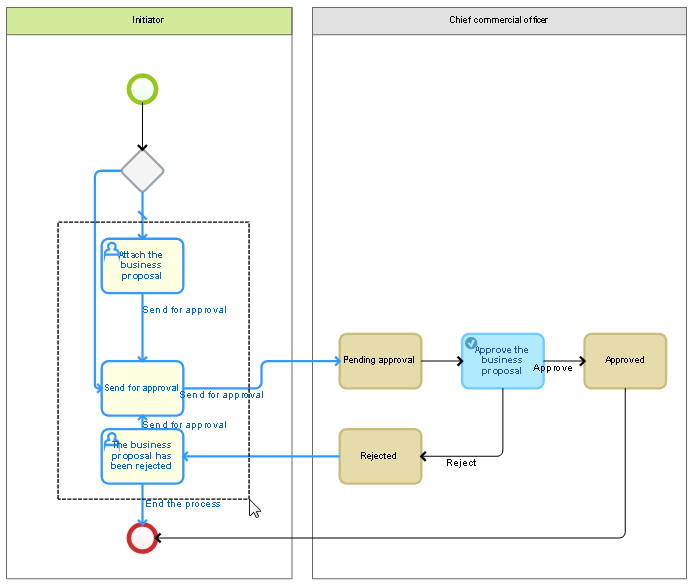
Fig. 1. The graphic model of the Approve Business Proposal process.
|
Adding Elements from the Side Toolbar
You can move elements from the side panel to the modeling sheet. This method is generally used to add the first element and the swimlanes. The system automatically generates the element name from the template that contains the element type and the element number in the diagram.
A new swimlane can be added to the graphic model only form the side panel. The swimlanes cannot overlap. I.e. you cannot drop a new swimlane on top of an existing one.
Other elements cannot be located outside swimlanes. When you drag an element to a swimlane, the system shows the position where it will be placed. You cannot place any elements on the border of a swimlane, except the artifacts. The program will not create a new element if you release the mouse button before placing it in a swimlane.
Adding Related Elements
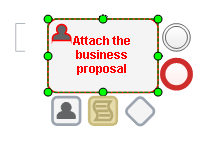
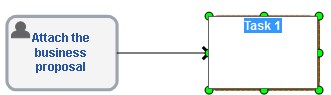
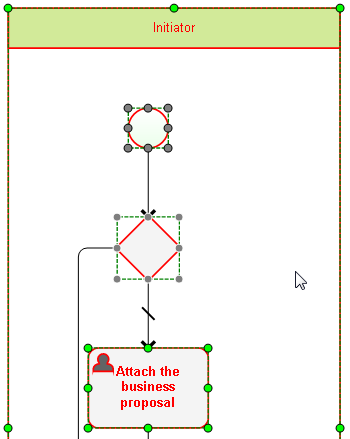
You can add a new element by clicking on the flow objects, which you have already placed on the modeling sheet. Move the mouse pointer to an activity and click once; icons appear showing you what elements you can add (fig. 2). Choose the one you need, drag it with your mouse and drop it in a suitable place on the modelling sheet (fig. 3). The Designer offers to change the element name and automatically creates a connector that links the existing flow object with the newly created.
|
|
|
|
Fig. 2. The Selected flow object that allows you to add other elements.
|
Fig.3. New added element (Task 1).
|
 - Annotation,
 - Task,
 - Script,
 - Gateway,
 - Intermediate event,
 - End event.
Selecting Elements
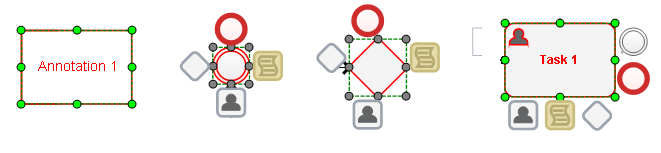
You can select the graphic model elements by clicking on them. To select a swimlane, click on its header.
|
|
|
Fig. 4. Selected elements of the process graphic model.
|
|
|
|
|
Fig.5. The selected connector.
|
Fig.6. The selected swimlane.
|
If you want to individually select several elements, click each element while holding the Ctrl key. You can also do that by selecting a window area with your mouse. The selected elements have blue outlines and a light-yellow background (fig. 7). If the selection box hits the swimlane border, the swimlane and all its elements will be selected. You can delete or move the selected group of elements.
|
|
|
Fig. 7. Highlighted elements of the process graphic model in the selecting box.
|
|
|
Connectors are links between the flow objects that show the sequence of the flow. The system automatically creates a connector, if you add a related element.
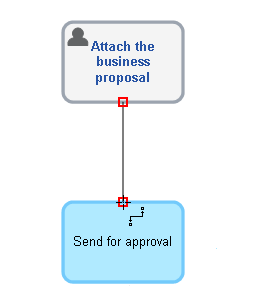
To link two elements with a connector, place a mouse pointer on one of them. Blue crosses appear along the perimeter of the element showing the connecting points (fig. 8). You can draw a connector toward other elements from these points. When you move a mouse pointer to the blue cross, it changes to a red square. A connection point of the second element is also marked as a red square. Click and hold the left mouse button and draw the connection toward the second element. After releasing the mouse button, the program creates a new connector.
|
|
Fig. 8.
|
|
|
|
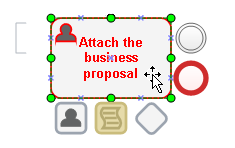
Select elements in the graphic model by clicking a mouse button. Now when you hover over the selected element, your cursor changes to an arrow (fig. 9). Click the left mouse button, drag the selected element to a new area and release the mouse.
It is not necessary to select elements to be able to move them. Simply move the cursor to any point inside the element, and drag it to a new position by pressing and holding the mouse button.
|
|
Fig. 9.
|
|
|
|
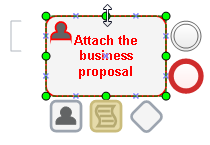
You can resize an element by dragging one of the green markers (Fig. 10) located along the perimeter of the element.
|
|
Fig.10. Changing the element size.
|
|
Scaling the Graphic Model
There are several ways to change the graphic model scale:
-
Using the zoom slider in the status bar in the lower right corner of the Designer (fig. 11);
-
Rotating the mouse wheel while holding the Ctrl button on your keyboard.
The current scale of the graphic model is shown to the left of the zoom slider. The adjust button ( ) next to the scale allows you to adjust the graphic model to the size of the model window. The model size is equal to the size of the modeling sheet.
|
|
|
Fig. 11. A zoom slider and a scale indictor.
|
Resizing the Modeling Sheet
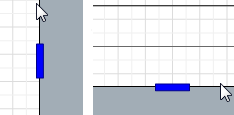
You can change the size of the modeling sheet if it does not match the size of the model. When you mouse over a border of the sheet, a blue rectangle appears in the middle of the border (fig. 12). You can resize the modeling sheet only when this indicator is visible. Hold the mouse button and drag the right or the lower border of the modeling sheet in the desired direction to change its size.
|
|
|
Fig.12. Resizing indictors
|
Working with the Modeling Sheet Grid
To enable or disable the grid click the grid control button ( ) on the status bar, in the lower right corner of the Designer. You may need to disable the grid, for example, when exporting a model as an image.
Undoing Changes
You can undo any action on the graphic model by pressing Ctrl+Z, or by clicking the Undo button ( ) in the Edit block of the toolbar. Any undone action can be redone by clicking the redo button (
 ) in the Edit block of the toolbar.
Element Сontext Menu
|
|
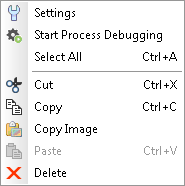
You can open the element context menu by right-clicking on it. Next to the commands of the context menu, you can see respective shortcuts.
|
The toolbar includes several blocks: the common blocks (located on the right side) are the same for all process tabs; the specialized blocks (located on left side) change when you switch between the tabs on the process page.
Unique blocks of the Graphic Model tab:
The side panel is located in the left part of the Graphic model tab. It may include the following sections, depending on the installed applications:
-
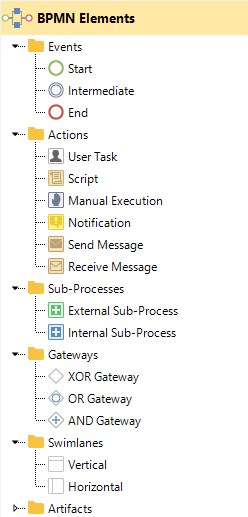
BPMN Elements – This basic ELMA BPM section contains the main BPMN elements used for process modeling.
-
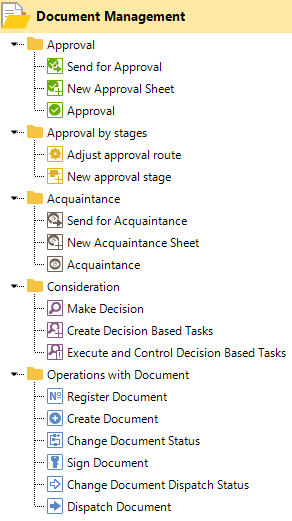
Document Management – This section becomes available when you install the ELMA ECM+ application. It contains all the elements (tasks and other activities) you may need to manage you document flow. These elements are not included in the standard BPMN.
-
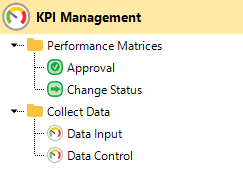
KPI Management – This section becomes available when you install the ELMA KPI application; it includes elements that allow you to manage your KPIs.
-
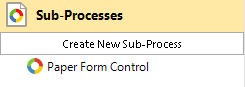
Sub-Processes – Another basic ELMA BPM section that contains a list of sub-processes of the current process. A sub-process contains all the context variables of the parent process. You can create a new internal sub-process by clicking Create New Process. To open a sub-process page double-click on its name.
-
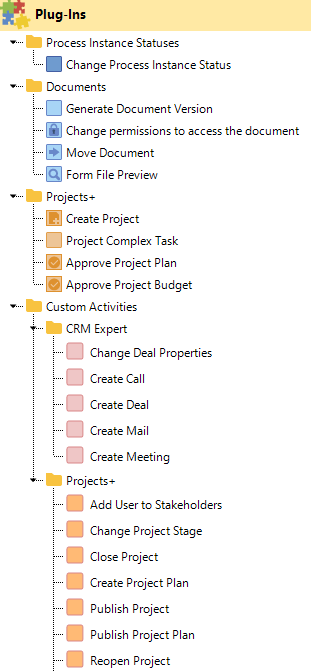
Plug-ins - This section contains elements created by ELMA developers. These elements are designed to perform specific tasks in the system, but are not included in the standard set of BPMN elements. Here you can also find custom activities.
|
|
-
Generate Document Version - Create a printable document form from a template using the process context.
|
|
|
-
Projects + - Available if you install the ELMA Projects+ application; contains the Project Complex Task.
|
|
|
|
|
|
-
Custom Activities – This block includes elements that you can modify according to your needs. The basic ELMA package may contain several ready-to-use custom activities, depending on the applications you have installed. For example, a set of elements for customer relationship management, CRM Expert, is added to the custom activities if you install the ELMA CRM+ application. If you install the ELMA Projects+ application, a set of elements for project management appear in the Custom Activities block. You can modify these elements on the Script tab of the ELMA Designer.
|
|
|
|
|
Fig.13. The side toolbar > The BPMN Elements section.
|
Fig.14. The side toolbar > The Document Management section.
|
|
|
|
|
Fig.15. The side toolbar > The KPI Management section.
|
Fig.16. The side toolbar > The Sub-Processes section.
|
|
|
|
Fig. 17. The side toolbar > The Plug-Ins sections.
|
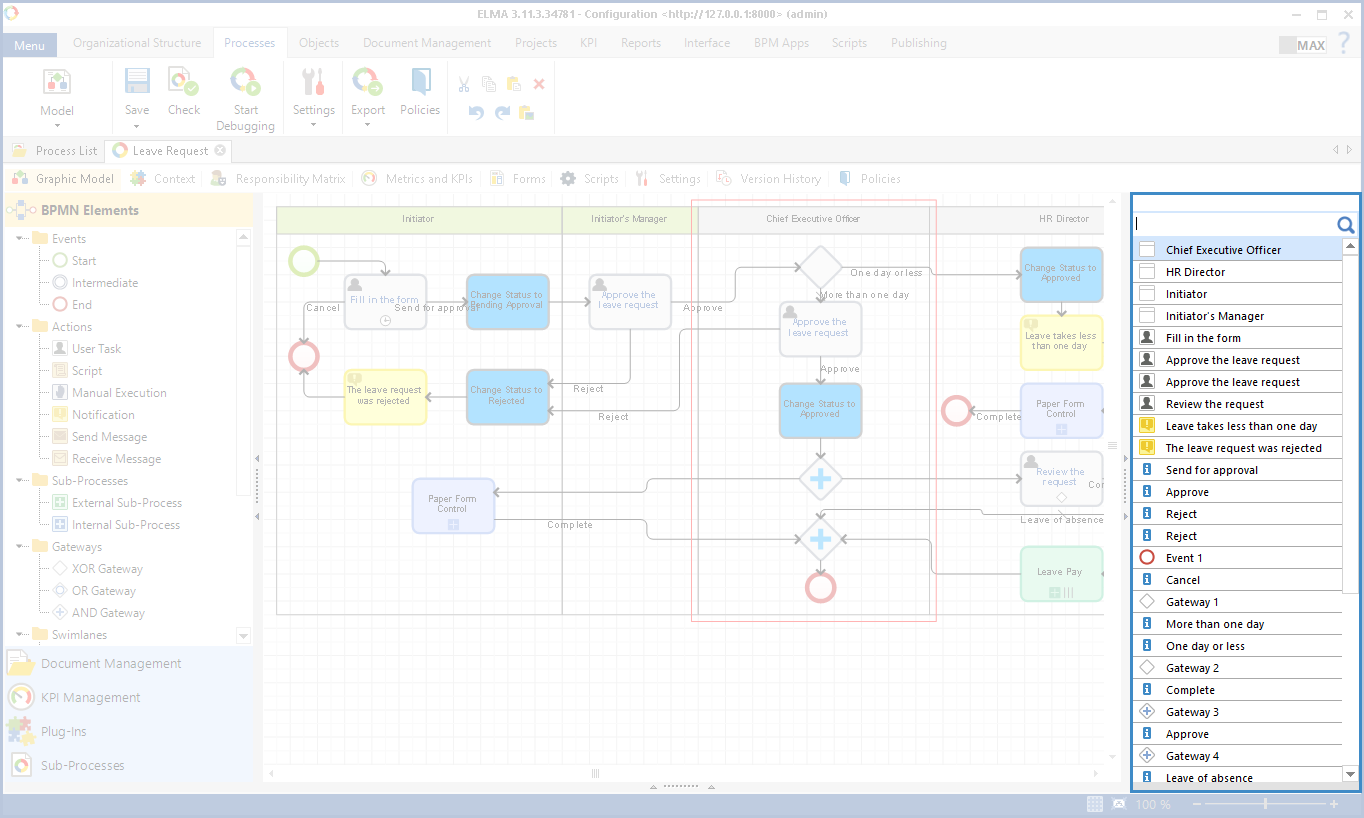
Searching in the process model
To start searching in the process graphic model, press
Ctrl+F or click on the

separator, located to the right of the model. The search panel and the list of all the elements, used in the model, will open (fig. 18).
Fig. 18. Process graphic model. Search panel and the list of elements
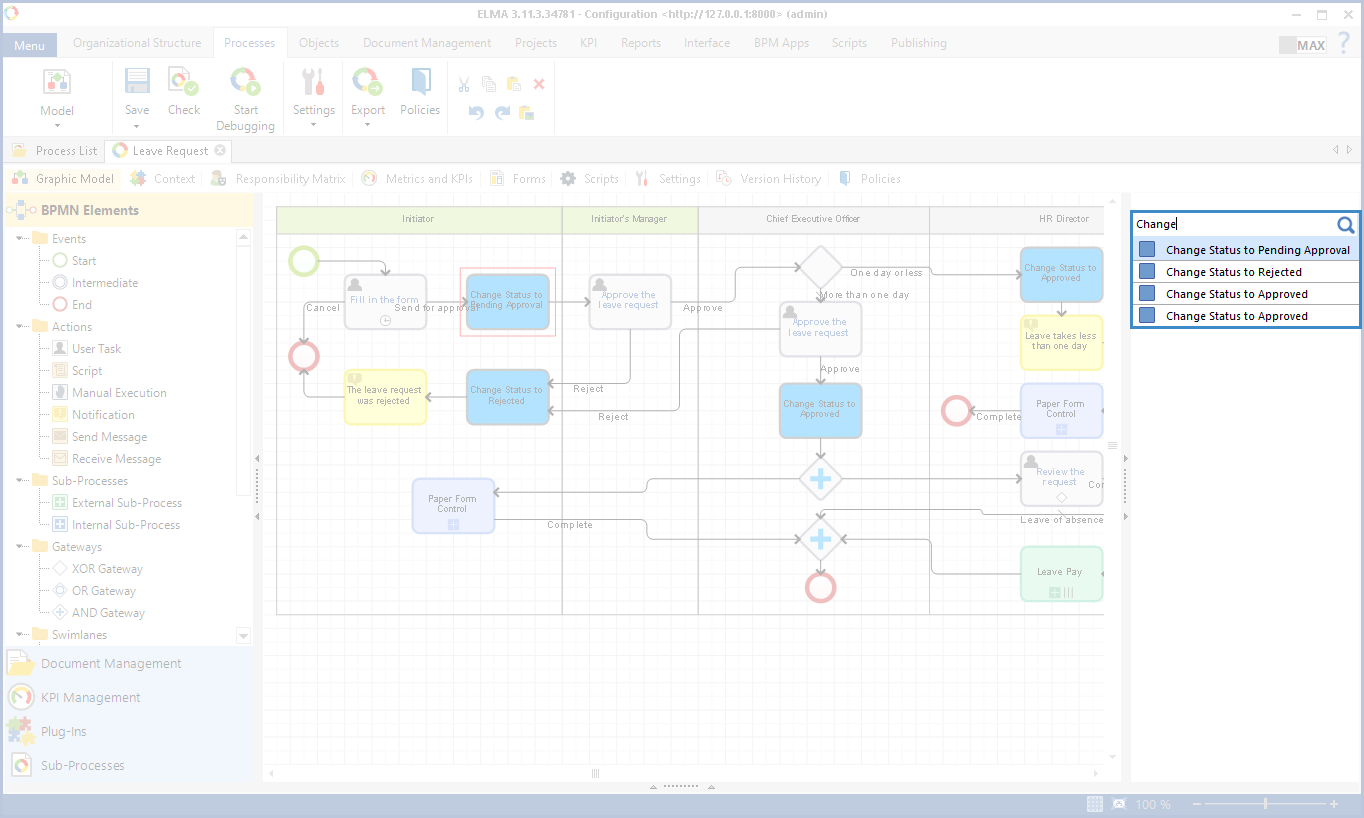
Enter an element name or a part of it in the search string and click on the

icon or press
Enter. All the found elements will be displayed under the search string (fig. 19).
Fig. 19. Process graphic model. Search results
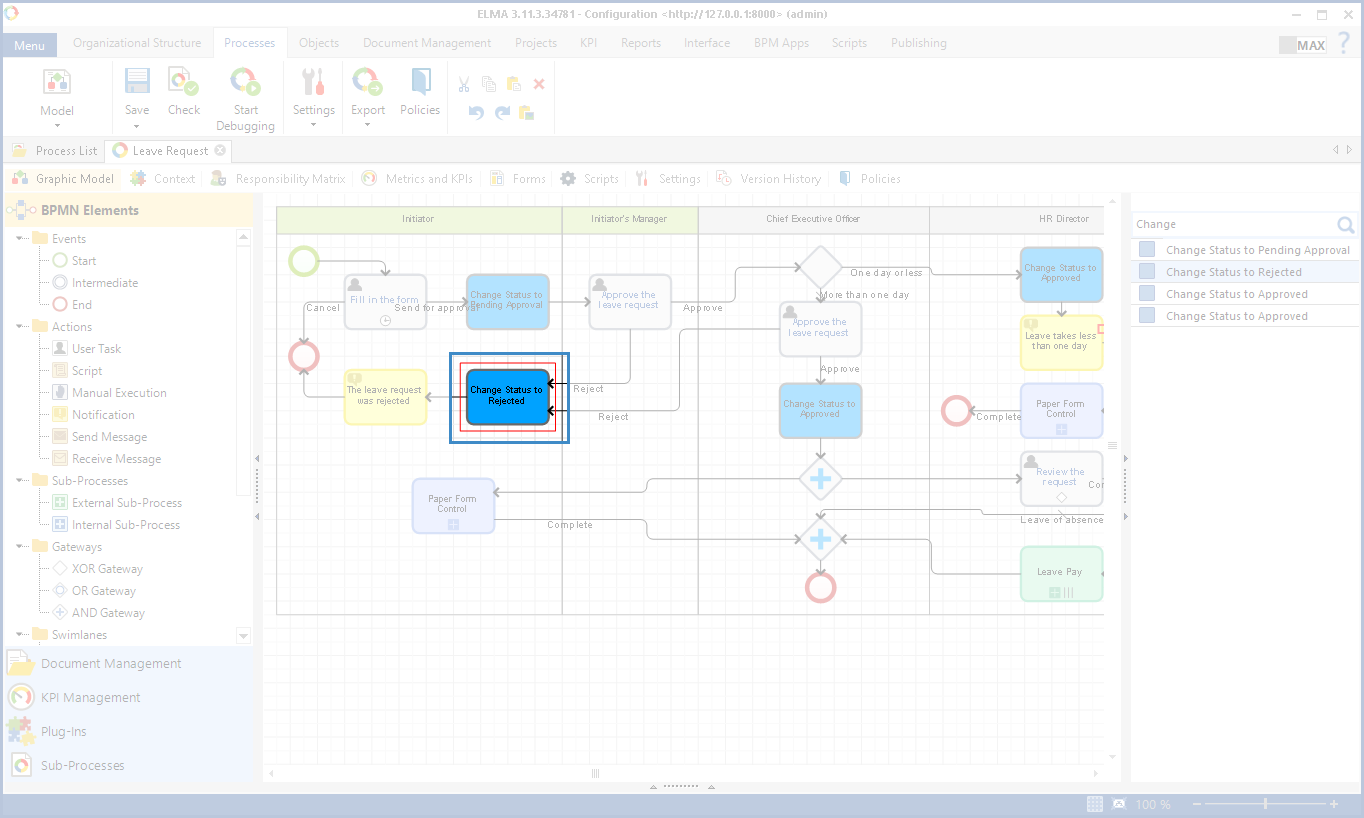
To highlight an element on the graphic model, click on the required element in the list. It will be enclosed in a red frame (fig. 20)
Fig. 20. Process graphic model. Highlighted element
To return to the full list of elements, clear the search string and click

or press
Enter.
To close the search panel, click on the

separator.
Copyright © 2006–2019 ELMA