Matrix reports in FastReport
Matrix reports in FastReport
The Matrix object is a type of table, and like the Table object, it consists of rows, columns, and cells. It is not known beforehand how many rows and columns a matrix will contain - it depends on the data.
The object looks like this:
When adding data, the matrix grows in height and width. The result may look like this:
Theory
Let's take a closer look at the matrix elements:
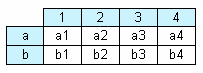
In the figure, you see a matrix with two rows and four columns. a, b – row headers, 1, 2, 3, 4 – column headers, a1..a4, b1..b4 – cells. To create such a report, you need only one set of data (query or table), which has three fields and the following data:
a 1 a1
a 2 a2
a 3 a3
a 4 a4
b 1 b1
b 2 b2
b 3 b3
b 4 b4
The first field contains the row number, the second – column number, the third – content of the cell on the crossing of the row and column with the specified number. When you create a report, FastReport creates a matrix in the memory and fills it with data. The matrix dynamically expands if a row or a column with the specified number does not exist yet.
Headers can have more than one level. Consider this example:
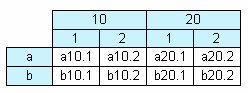
In this example, the number or index of the column consists of two values. This report requires the following data:
a 10 1 a10.1
a 10 2 a10.2
a 20 1 a20.1
a 20 2 a20.2
b 10 1 b10.1
b 10 2 b10.2
b 20 1 b20.1
b 20 2 b20.2
The first field, as before, contains the row index and the second and third fields - the column index. The last field contains the cell value.
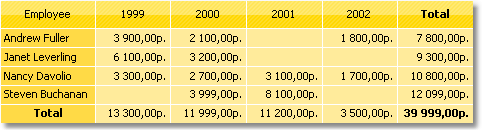
The following matrix element - subtotal and total - is demonstrated by this figure:
.png)
This report is based on the same data, as the previous one. The grey columns in the figure are calculated automatically.
Configuring the structure
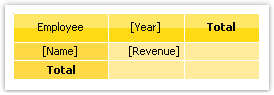
After you've placed a new Matrix object to the report sheet, it looks like this:
.png)
To configure the matrix structure, drag the data source fields from the Data panel to the matrix. This way you will create rows, columns, and cells. The place where the new data will be inserted is highlighted red:
.png)
If the matrix already contains elements (headers, cells), then when you insert a new element an indicator is displayed. In this example, the new field will be inserted between the Year and Name fields:
.png)
You can also change the order of existing elements by dragging and dropping them:
.png)
To delete an element, select it and press Delete.
Configuring a header
To configure a header element, right click on it to open the context menu:
.png)
By default, the data in the matrix header are sorted in the ascending order. You can change sorting by selecting Sort in the menu.
To each field that you add to a matrix header FastReport adds the total (a cell with the "Total" text). You can delete the total by selecting it and pressing Delete. To bring it back, open the context menu of an element and select Totals.
The Start New Page item allows breaking up the page when printing a matrix. If you enable this option for the Year cell, as shown in the figure above, then each year will be placed on a separate page when printing the matrix.
The Suppress Totals option allows suppressing the total row if the group, for which the total is calculated, contains only one value.
Configuring cells
For the matrix cells, you can select a function that will be used when calculating totals. Its value will be displayed in the total rows and columns. Below is the list of functions that you can use:
|
Function |
Description |
|
None |
Cell values are not processed. |
|
Sum |
Returns the total of values in the matrix cells. |
|
Min |
Returns the minimum value. |
|
Max |
Returns the maximum value. |
|
Average |
Returns the average value. |
|
Count |
Returns the number of non-empty values. |
For the cells added to the matrix, the sum function is used by default. You can select another function in the context menu of a cell by selecting Function:
.png)
Select No, if you are not going to print the totals on this cell.
A matrix can contain one or several data cells. If there are several cells, they can be placed next to each other vertically or horizontally. You can also select the cells order when adding the second cell to the matrix. The red indicators will show where the second value will be added (above-below or left-right):
.png)
After you have added the second value, all the consequent values will be added in the selected direction.
Configuring the matrix size
Since a matrix is a type of the Table object, it allows setting the row and column size in a similar way.
By default, the Autosize mode is enabled for the matrix. In this mode, the object sets the column width and row height automatically, depending on the content. You can also manage the size of the object manually. To do so, disable the Autosize property of the matrix. Rows and columns have a similar property; you can use it if autosize is disabled for the matrix.
To limit the minimum and maximum height of a row, select a row and specify the values of MinHeight and MaxHeight on the properties panel.
To limit the minimum and maximum width of a column, select a column and specify the values of MinWidth and MaxWidth on the properties panel.
Example
Let's create a simple query:
select u.FullName, st.Name, s.Responsible, s.SaleStage, DATENAME(month, s.StartDate) as month,
s.id, c.Name as ContractorName, s.PoverkaFakt, us.FullName as auth
from Sale as s

left join "User" u on u.id = s.Responsible
left join "User" us on u.id = s.Author
left join SaleStage st on st.id = s.SaleStage
left join Contractor c on c.id = s.Contractor

where s.SaleStage is not null.png)
Add the data to the layout, using the tools described above:
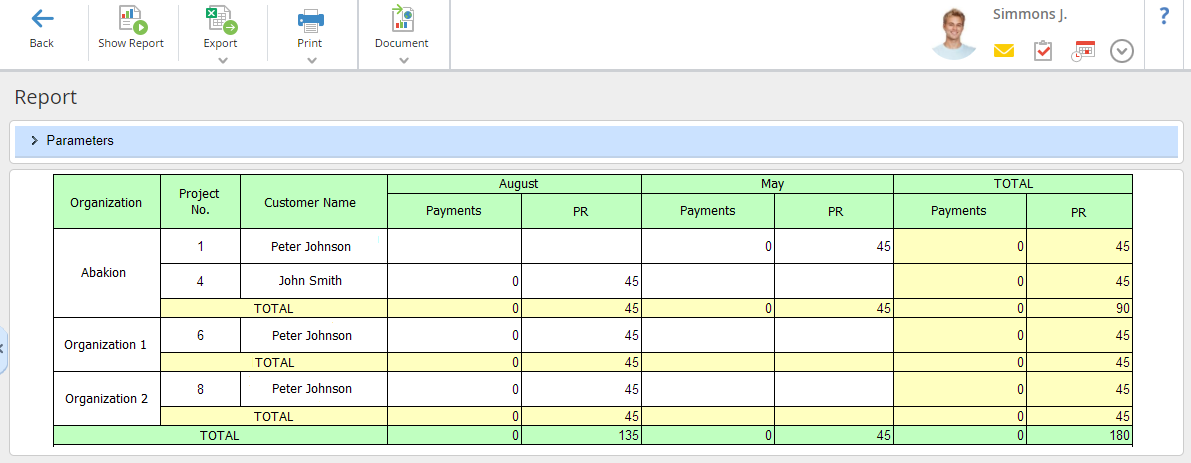
.png)
As the result, you get a report, where the data are organized as follows: columns with months and rows with organizations. The report calculates the totals of each organization for all months and the total for all the organizations and for each month.