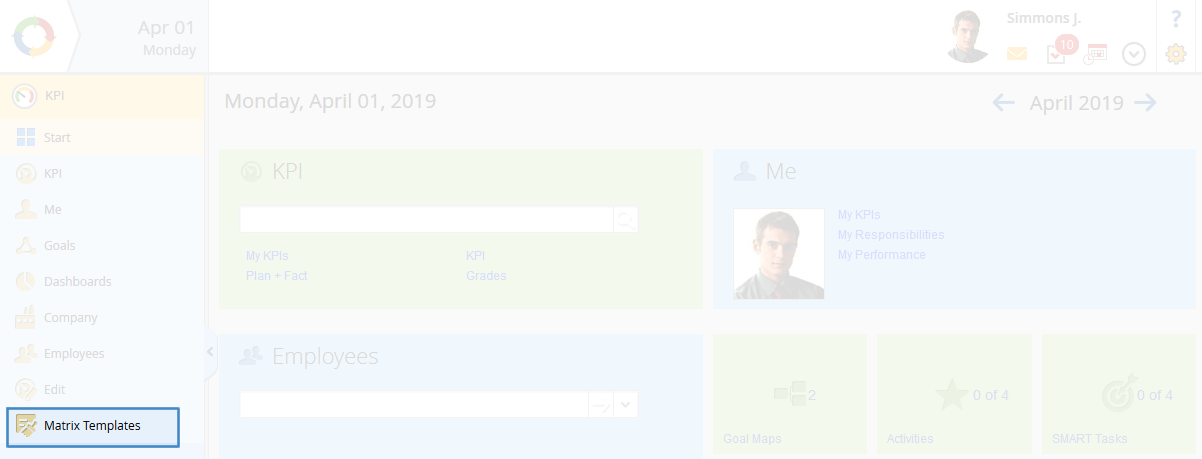
Creating a Performance Matrix Template
Fig. 1. KPI section. Matrix Templates unit
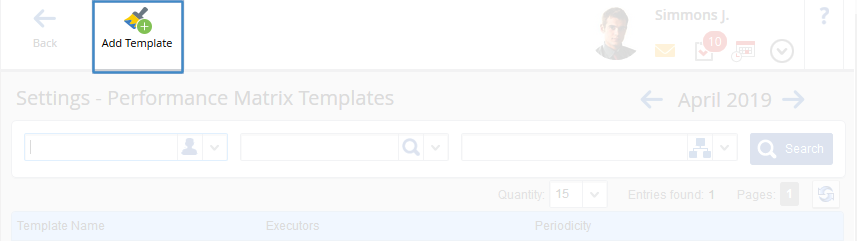
Click Add Template in the top menu on the page that opens (fig. 2).
Fig. 2. Add Template button for creating a performance matrix template
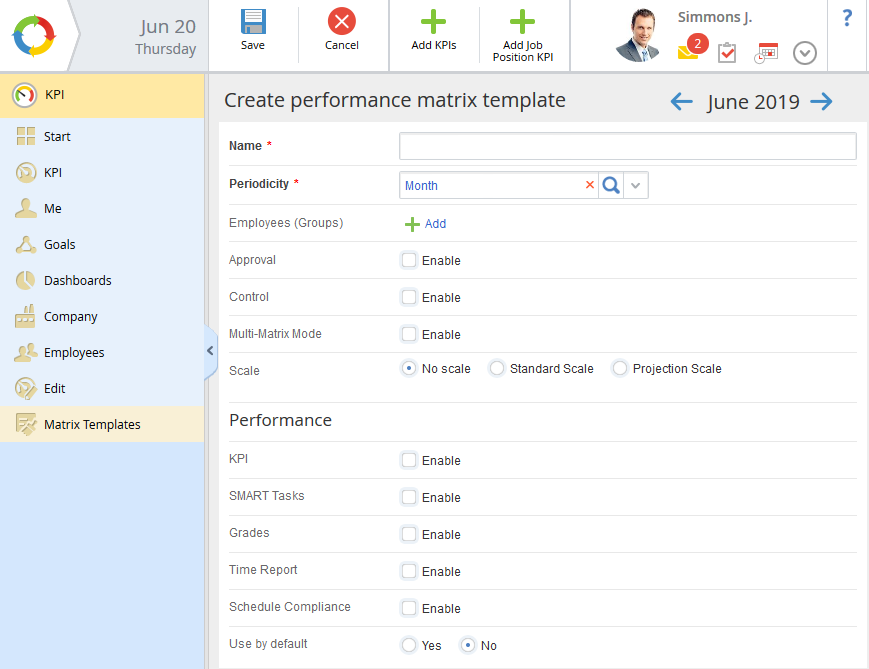
The template creation form will open which looks in the following way (fig. 3):
Fig. 3. Performance matrix template creation form
Template creation form (fig. 3) consists of the following parameters:
Name* – the name of the template which will be displayed in the template list. This field is required.
Periodicity* – how often the performance is assessed (every year, quarter, month, six months). By default, the Month parameter is selected. This field is required. Please note that if the template includes indicators with a periodicity different to the periodicity of the performance matrix, the values of these indicators will not affect the performance calculation.
Employees (Groups) – add
users,
job positions or
user groups for whom the performance matrix generated from this template will be used. You can add several users, user groups or job positions by clicking the

button.
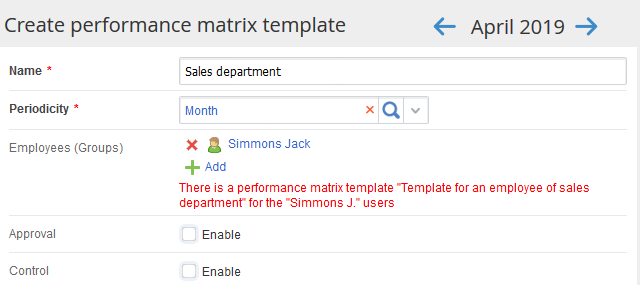
Based on this template, the performance matrix of all the employees chosen in the
Employees (Groups) field will be generated. If the
multi-matrix mode is disabled in a matrix template, a warning will appear when creating a new performance matrix template for the selected employees and it will be impossible to save the template (fig. 4).
Fig. 4. Create performance matrix template page. System warning
When the
multi-matrix mode is disabled, the matrices are created in the following priority sequence:
Single user template –> Organizational structure element template –> User group template –> Default template. Therefore, if there are several templates available for one user (for example, a template for this specific user, a template for a group that he or she is included in, and the default template), the performance matrix will be created from the highest priority template – the user template.
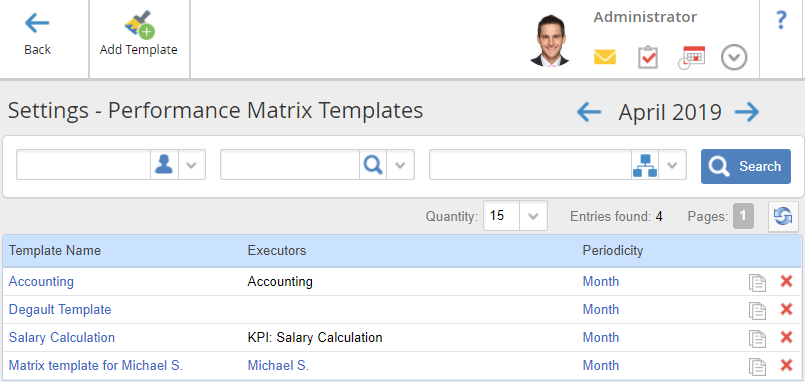
Consider the following example. Stephany Michael is an accountant and is included in the KPI: Salary Calculation user group. There are four performance matrices templates available for her (fig. 5).
Fig. 5. List of performance matrix templates available for Stephany Michael
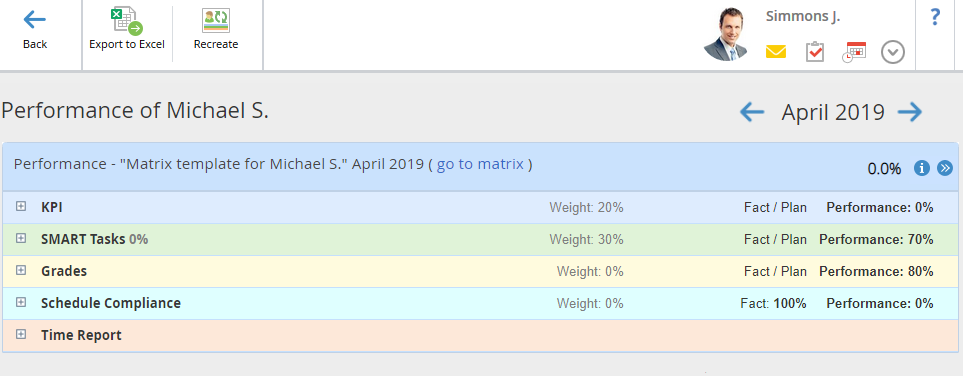
Since the multi-matrix mode is disabled for all of the templates, the performance matrix for Stephany will be created from the single user Matrix template for Michael S. (fig. 6).
Fig. 6. Performance matrix of Stephany Michael
Creating matrix templates in the multi-matrix mode is described
below.
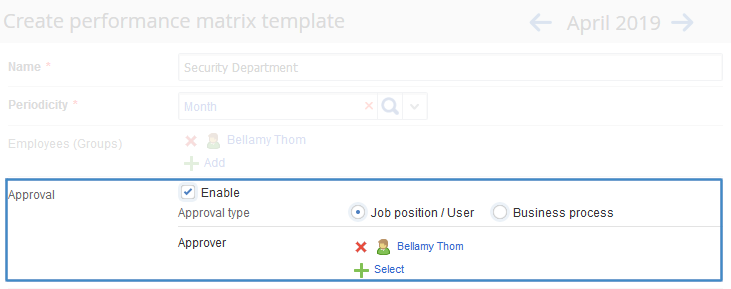
Fig. 7. Create performance matrix page. Approval unit
After that the Approval type parameter will be shown where you need to choose how the performance matrix will be approved:
-
Job position/User – if you choose this parameter, the
Approver field will be displayed below. Use the

button to select a
job position or
user who will approve the performance matrix generated from this template. If some users were selected as approvers, they will be automatically added to the
To field when
sending the matrix for approval;
-
Business process – if you choose this parameter, the Approval Process field will be displayed below where you need to choose a business process during which this performance matrix will be approved. To learn more, read the
respective Help page.
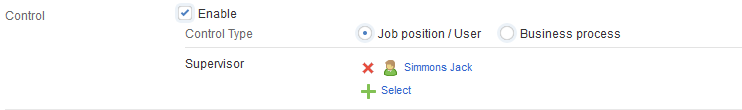
Fig. 8. Create performance matrix template page. Control unit
Enable the Multi-matrix mode in order to create and use multiple performance matrix templates for one
user,
user group and/or
job position.
Matrices for a user will be created from the
highest priority template and from all the templates with enabled multi-matrix mode.
Scale
By default, the No scale parameter is selected (fig. 3). In this case, color indicators of performance statuses will be grey, and the matrix performance – black.
In fig. 9 you can see an example of a performance matrix page generated by template without a scale.
Fig. 9. Performance matrix page generated by template without a scale
Choose one of the two parameters Standard Scale (fig. 10) or Project Scale (fig.12) in order to enable the color indicator of the performance status and to display the performance matrix.
-
Standard scale (fig. 10) allows configuring the boundaries of color display depending on the final performance of the matrix.
-
Projection scale (fig. 12) allows specifying the intervals of intermediate values of efficiency of the matrix, set the output values, as well as the color display for each of the intervals. In this case, the final performance of the matrix will be calculated not in percents, but in points.
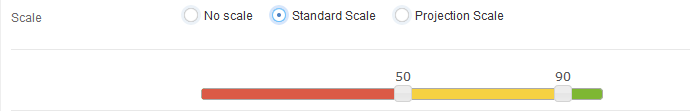
Standard scale:
Fig. 10. Create performance matrix template page. Scale unit. Standard scale type
The scale determines the color of the performance coefficient, its status in the efficiency matrix:
-
red – performance coefficient is below the minimum acceptable value;
-
yellow – performance coefficient is within acceptable values;
-
green – performance coefficient is above the maximum acceptable value.
If the Scale is disabled, color indicators of the performance status of the Performance Dynamics diagram will be gray, and the color of performance coefficient will be black. The total size of the scale is 100%. You can define the statuses border by moving the sliders left/right.
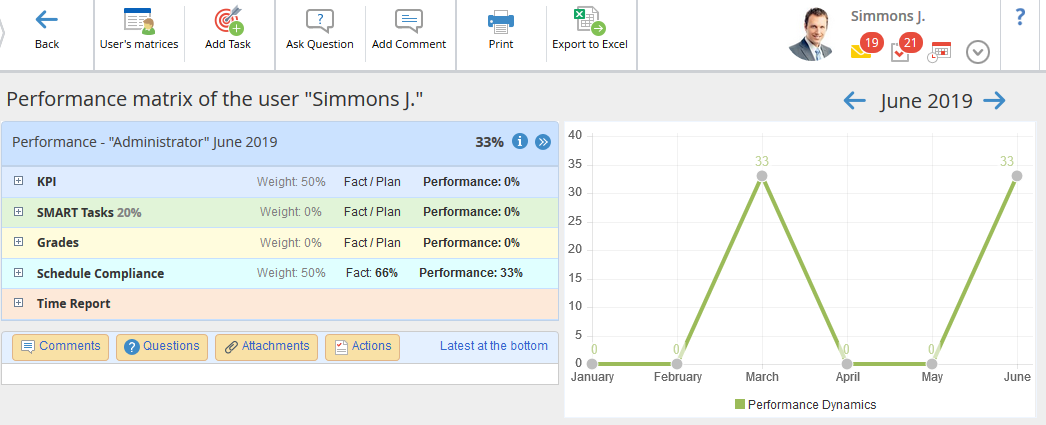
In fig. 11 you can see an example of a
performance matrix page generated by the template with the
Standard Scale type.
Fig. 11. P
erformance matrix page generated by the template with the
Standard Scale type
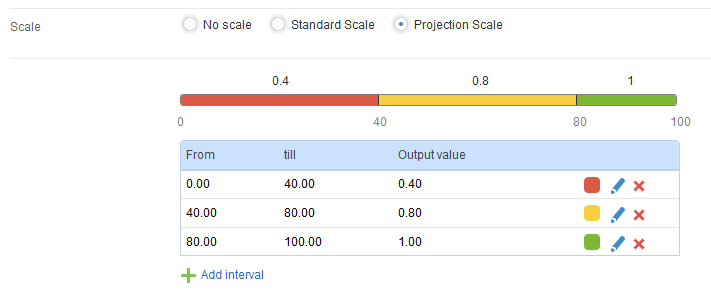
Projection Scale:
Fig. 12. Create performance matrix template page. Scale unit. Projection scale type
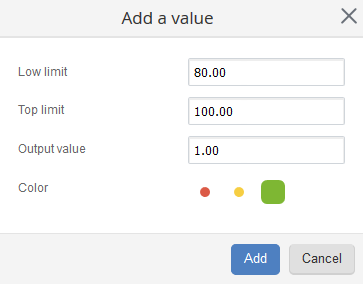
In order to set the range of values, as well as the output value and color display for this interval, click the Add interval (fig. 12). A dialog box will open (fig. 13) in which you need to enter the required values and click the Add button.
Fig. 13. Add a value dialog box
Low limit – the smallest value in the interval (in percent).
Top limit – the biggest value in the interval (in percent).
Please note that the rule X ∈ [<Low limit>; <Top limit>) if the following interval is specified: that is, if the intermediate value of the matrix performance is equal to the value specified in the Top limit field and the next interval is specified in the template, this value will be excluded from this interval. For example, if the template in the first interval in the Low Limit field is 40, and the Top Limit field is 80 and the following interval is specified in the template, then for an intermediate value of 80, the final value will take the color display, as well as the output value of the second interval.
If the Low limit and/or Top limit fields are not filled, the value -∞ ("minus infinity") or + ∞ ("plus infinity") will be used, respectively.
Output value – the total value of a matrix performance (in points), which will be displayed if the intermediate matrix performance belongs to the specified interval.
Color – this parameter allows you to set the color indicator of the performance status, as well as the color display of the final matrix performance in a given interval.
To change the previously specified interval, click

to the right of the required interval on the
Create/Edit Performance Matrix Template page.
Click

to the right of the required interval to delete it. Click
Yes to confirm deletion.
If an intermediate value of a matrix performance does not fall into any of the specified intervals, the final value in the performance matrix will be zero and will be displayed in black. The performance status on the Dynamics chart will be gray.
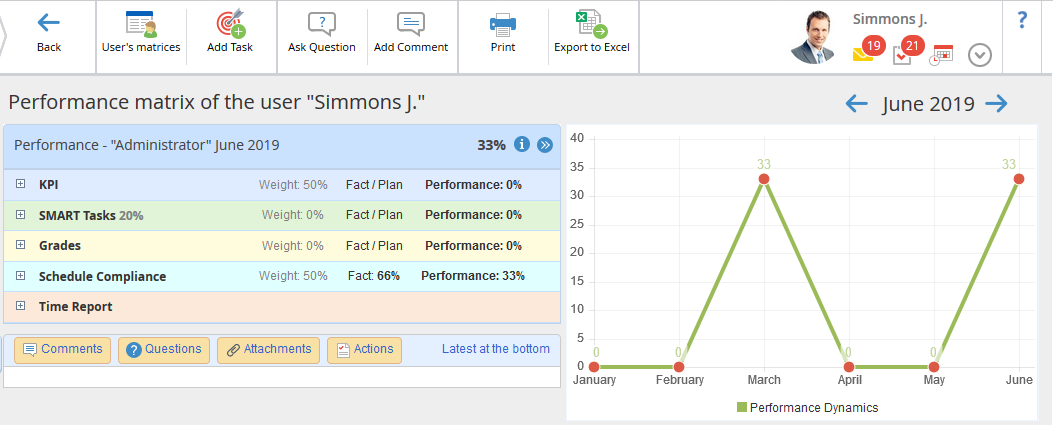
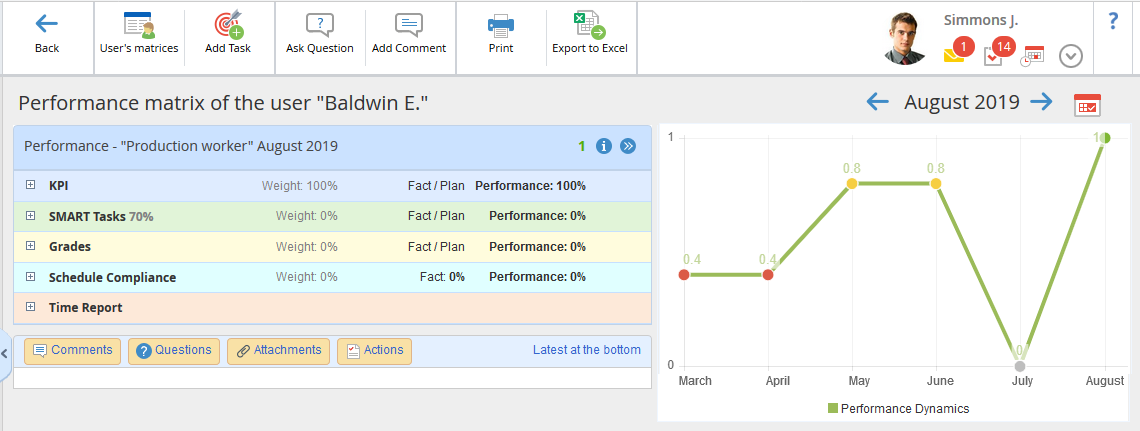
In fig. 14 you can see an example of a performance matrix page generated by the template with the Projection scale type:
Fig. 14. P
erformance matrix page generated by the template with the
Projection Scale type
To view the performance evaluation formula, click

in the upper right corner of the
Performance table. To find out more, read the
respective Help page. Performance section
In this section (
fig. 3),
Enable the unit which will affect the calculation of an employee's performance.
KPI
When you
Enable this unit, you can add
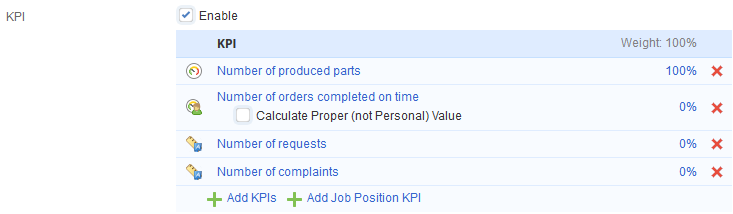
KPIs based on which an employee's/job position's performance will be assessed (fig. 15).
Fig. 15. Create performance matrix template page. KPI unit
Click
Add KPIs to select the
indicators that will affect the performance calculations. The list includes all the
indicators created by the current user. To select the required
indicators, check them in the window that opens and click
Add.
Click Add Job Position KPI to select a KPI or a group of KPIs which the selected job position is responsible for. Check the required positions in the window that opens.
You can also find these buttons in the top menu of the page.
To the right of the selected KPIs are the weights of the values of these indicators (fig. 15) in the overall performance assessment. Click on the percent to edit them. Assigning a higher weight to an indicator increases its importance in the overall performance assessment of an employee.
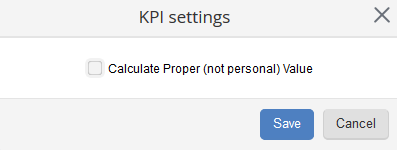
When you add a
personal and/or row object KPI/metric, two copies of the same KPI/metric will be automatically added. The difference is in the additional settings of the KPI. To configure the settings, click

to the right of the required KPI (fig. 15). Note that:
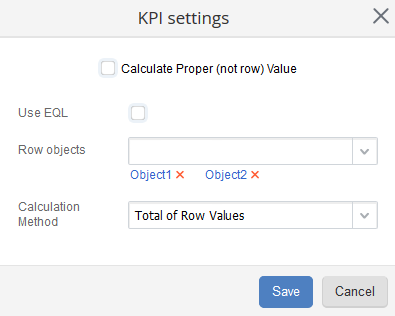
Fig. 17. Create performance matrix template page. KPI section. Row object KPI settings dialog box
For a row object KPI, you can specify row objects that participate in calculating the performance of
matrices generated by this template and also choose the calculation method (if you uncheck the box
Calculate Proper (not row) Value) (fig. 17). To do so, in the drop-down lists choose the required row objects and calculation methods (by default, the
Total of Row Values method is selected).
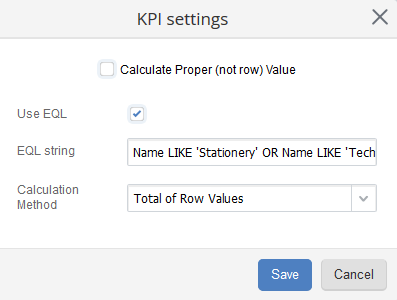
Besides, you can specify row objects with the help of an
EQL query. To do so, check the
Use EQL box and in the field that appears enter your
EQL query (fig. 18).
Fig. 18. Create performance matrix template page. KPI section. Row object KPI settings dialog box. EQL query
SMART Tasks
A
SMART task is a special task that is assigned for a certain period (month) to a responsible employee, aimed at assessing the employee’s additional actions and influencing the calculation of the employee’s performance assessment.
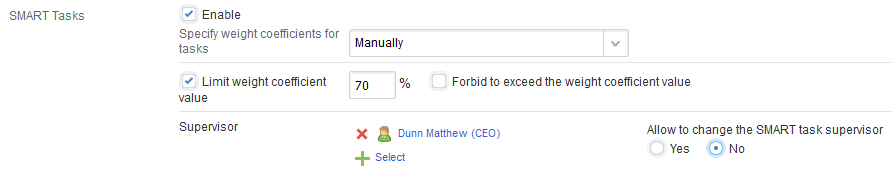
Click Enable in the SMART Tasks unit to make SMART tasks affect performance matrices (fig. 19)
Fig. 19. Create performance matrix template page. SMART tasks unit
Specify weight coefficients for tasks – choose how weight coefficients for
SMART tasks will be counted from the drop-down list:
1. Manually – the weight of a
task will be specified manually in a
performance matrix. If you choose this option, the
Limit weight coefficient value checkbox will be displayed below. It allows limiting the total amount of weights for all
SMART tasks in a performance matrix generated by this template. When you check this box, the field for entering values in percent (the maximum value is 100) and the checkbox
Forbid to exceed the weight coefficient value will appear.
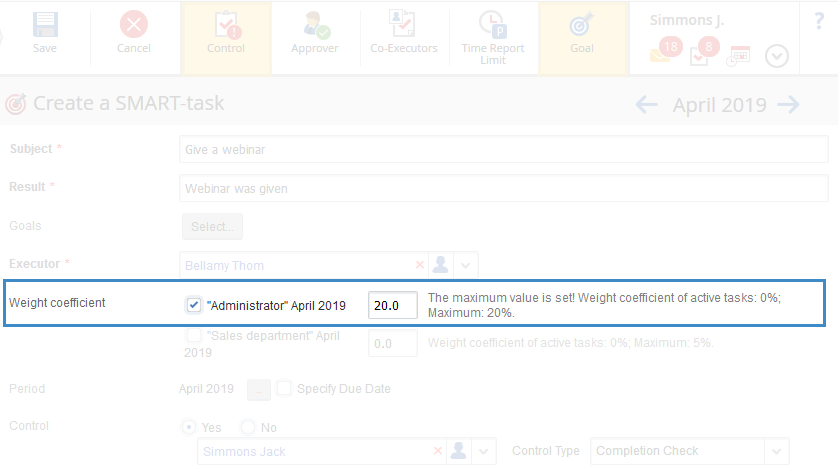
If you
limit the weight coefficient value to, for example, 70%, the following will happen when creating a
SMART task for this matrix:
-
If the box
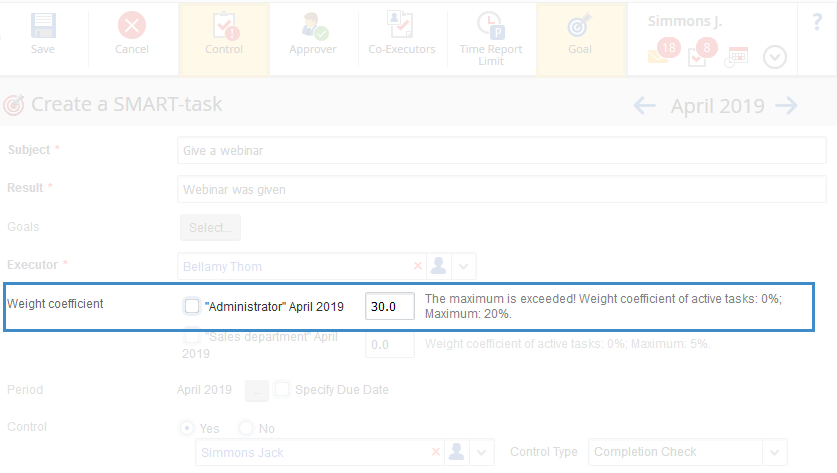
Forbid to exceed the weight coefficient value is checked, the system will not allow inserting a bigger weight. The inserted value will be changed to the maximum possible and to the right of the weight field when creating a SMART task a warning will appear that the maximum weight has been exceeded (fig. 20).
Fig. 20. Create a SMART task form. Warning that the maximum weight has been exceeded
-
If the box
Forbid to exceed the weight coefficient value is unchecked, a warning to the right of the weight field will appear when creating a SMART task (fig. 21). The entered value will not be changed.
Fig. 21. Create a SMART-task form. Warning thatthe maximum weight has been exceeded
Please note that when entering a SMART task weight, the weights of all SMART tasks created as part of this performance matrix of a user are summed up.
The
Supervisor field (
fig. 8) includes the following elements:
-
the

button allows choosing a supervisor for all SMART tasks created in performance matrices by this template;
-
the switch
Allow to change the SMART task supervisor. By default, when
creating a SMART task, a supervisor will be chosen specified in the
Supervisor field. This switch set to
Yes allows changing the supervisor.
2. Automatically based on the plan time report – the total weight of all
SMART tasks will be calculated as the difference between the sum of indicators, grades and schedule compliance to 100% (total performance weight). In this case, the weight of each SMART task will be calculated in proportion to the plan time report of a task to the sum of all the planned hours. Apart from that, when choosing this option for entering weights, there is an opportunity to specify the
Approver and
Controller for SMART tasks.
3. Automatically based on the fact time report – the total weight of all
SMART tasks will be calculated as the difference between the sum of indicators, grades and schedule compliance to 100% (total performance weight). In this case, the weight of each
SMART task will be calculated in proportion to the fact time reports of the task to the sum of all the fact hours. The set of fields when selecting this option for input of weights is similar to the set of fields when selecting the option
Automatically based on the plan time report.
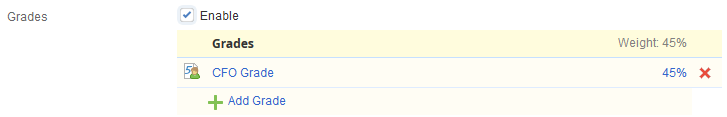
Grades
Click
Enable in the
Grades unit to use expert grades for counting a
performance matrix (fig. 22).
Fig. 22. Create performance matrix template. Grades unit
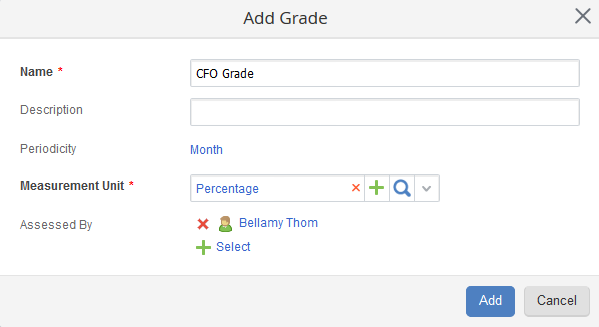
Click
to add a grade. A dialog box (fig. 23) will open where you need to fill in the required fields.
Fig. 23. Creating expert grade
Name* – the name of the created grade. This field is required.
Description – a short description of the created grade.
Periodicity (Month – cannot be changed).
Measurement Unit* – select the measurement unit for the grade (percentage or points). If another unit of measurement is required, a user with certain access permissions can add it to the
Grade Measurement Unit object. This is a required field.
Assessed By – click
to add a user who will assess an employees' performance.
Click
Add when all the fields are filled. To learn more about how to work with grades, read the
respective Help page.
Time Report
Check the
Enable box if you want
time reports to be displayed in the
performance matrix.
Time report does not affect the calculation of an employee's performance. Some companies pay an hourly rate, and time reports allow paying wages that correspond to the number of hours an employee worked.
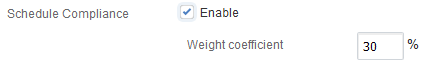
Schedule Compliance
Another method to assess an employees' performance is schedule compliance (fig. 24).
Fig. 24. Schedule compliance unit
Check the
Enable box and specify the weight coefficient (in percent) if you want
Schedule compliance to be displayed in the
performance matrix. This unit displays the total number of tasks, the number of tasks completed on time, and the number of overdue tasks in the current month.
Use by default – a switch that allows you to determine whether or not the current default template should be used to display the employee performance matrix. If this switch is set to Yes, this performance matrix template will be used by default for all employees, unless another template is set for them.
Copyright © 2006–2019 ELMA