Selecting KPIs for elements
For each element (except for
Indicator value) of the
Diagrams unit, choose KPIs in order to display the information about these KPIs’ values in the web application. To do so, choose
Select KPIs… in the
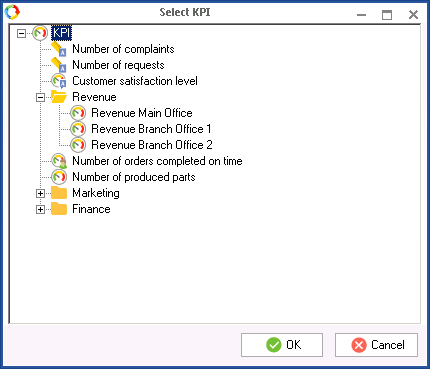
context menu of an element, and in the window that opens (fig. 1) choose the required KPIs.
Fig. 1. Select KPI window
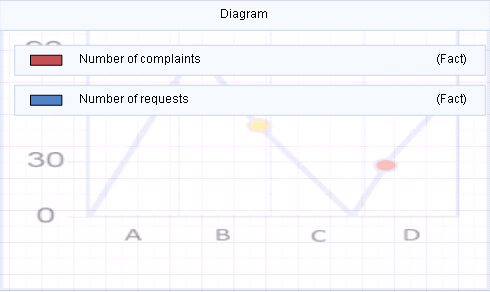
The chosen KPIs will be displayed on the form of an element as a list (fig. 2).
Fig. 2. Selected KPIs on the Diagram element form
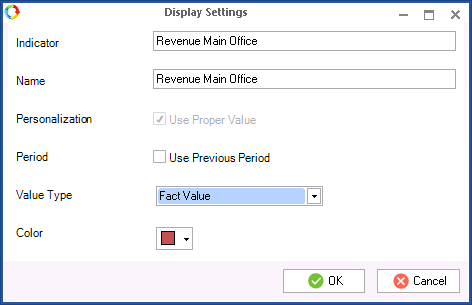
Each KPI on the element form can be configured. To do this, double-click on it. The KPI display settings window will open (fig. 3). Choose the required settings and click OK.
Fig. 3. Display settings window
Indicator – the name of a chosen indicator in the KPI tree. This field is for information purposes only and cannot be changed.
Name – the name of an indicator that will be displayed in the web application. This field is filled in automatically, but if necessary, its value can be changed.
Personalization – when this box is checked, the current value of the indicator will be used for the currently authorized user in the web application. This field is available only for
personal KPIs.
Period – when this box is checked, the previous period will be used to display the value of the indicator (by default, the current period is used to display the indicator values).
Value Type – from the drop-down list, select the type of the indicator value (plan, fact) that will be displayed in the web application.
Color – the color in which the indicator values will be highlighted in the web application.
Element display settings
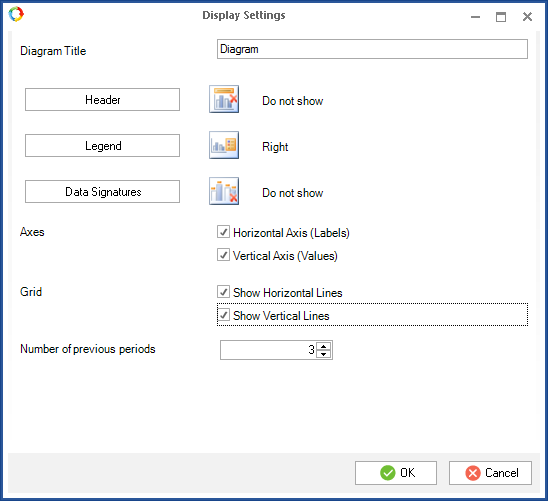
Each element of the Diagrams unit is configurable. Double-click on the element to open its settings window (fig. 4).
Fig. 4. Display settings window of the Diagram element
Diagram title – the element title that will be displayed in the web application.
Header – the button that helps to position the header on an element in the web application:
-
Do not show – the header will be hidden;
-
At the center with overlap – the header will be displayed in the top part of the diagram;
-
Above the diagram – the header will be displayed above the diagram.
Legend – the place where the legend is shown (At the top, At the bottom, Right, Left, Do not show).
Data Signatures – the place where data signatures are shown:
-
Do not show – data signatures will not be displayed in the diagram;
-
In the center – data signatures will be displayed inside the diagram columns;
-
At the top, inside – data signatures will be displayed in the upper part of the diagram;
-
At the bottom, inside – data signatures will be displayed inside the diagram columns in the lower part;
-
At the top, outside – data signatures will be displayed inside the diagram in the upper part.
Axes – choose the axes that must be displayed in the web application.
Grid – choose how the grid must be displayed in the diagram.
Number of previous periods – the number of the previous periods for which you want to display the indicators values in the web application. The maximum number of displayed periods is 48. Please note that the current period is displayed by default and is not included in this number. For example, if you set the number of previous periods to 3, the web application will display the indicator values for the previous 3 periods, as well as for the current period. If you want the indicator values to be displayed only for the current period, set this parameter to 0.
Copyright © 2006–2019 ELMA


