How to Work with Information Elements
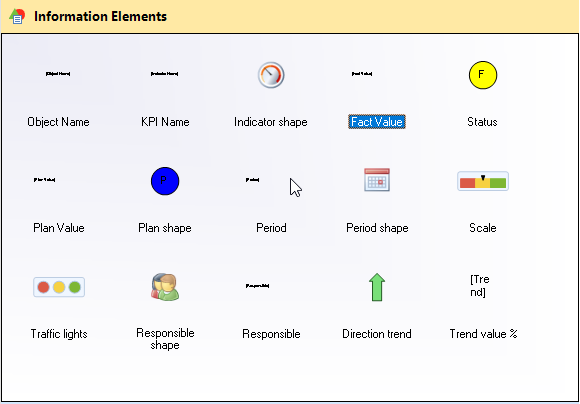
Information elements are located on the elements panel in the Information elements unit (fig. 1).
Fig. 1. Toolbox. Information elements unit
Binding an information element with a KPI model object
To display indicator values in the web application, information elements must be bound with KPI model objects. To do this, in the
context menu of an item, select
Bind to Object.
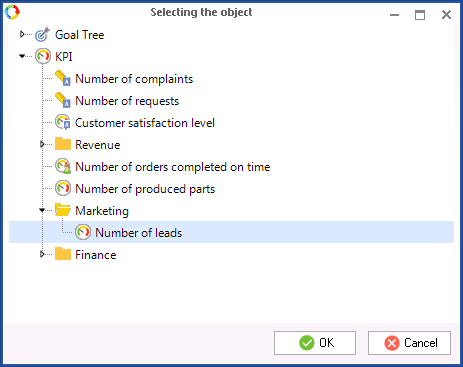
Selecting the Object window will open (fig. 2).
Fig. 2. Selecting the object window
Creating a KPI display template
Using information elements, you can create custom templates for displaying KPI values in the web application.
In order to create a KPI display template, take the following steps:
1. Add any shape to the dashboard diagram and
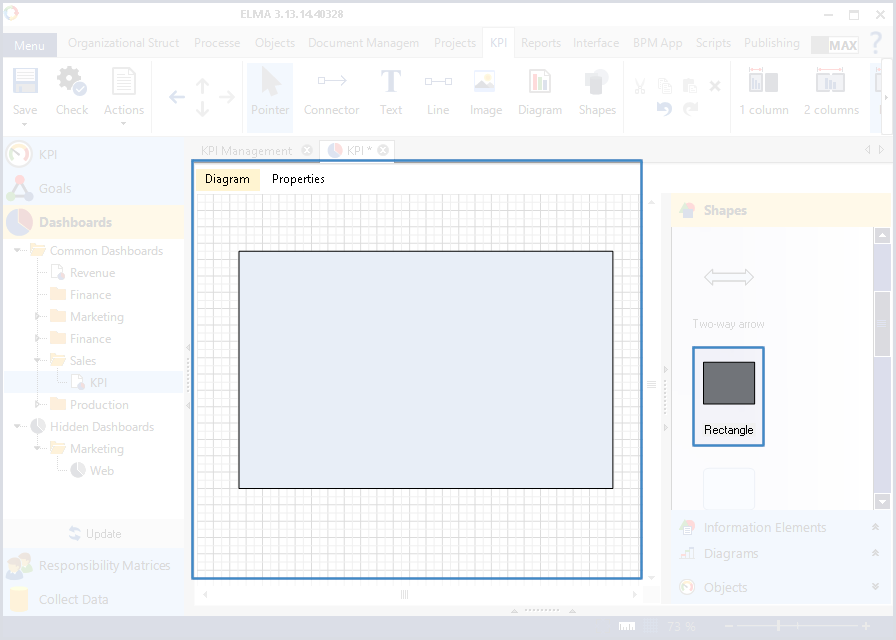
configure it. This shape will be the background for the template being created (fig. 3)
Fig. 3. Creating a KPI display template. A rectangle added to the dashboard diagram
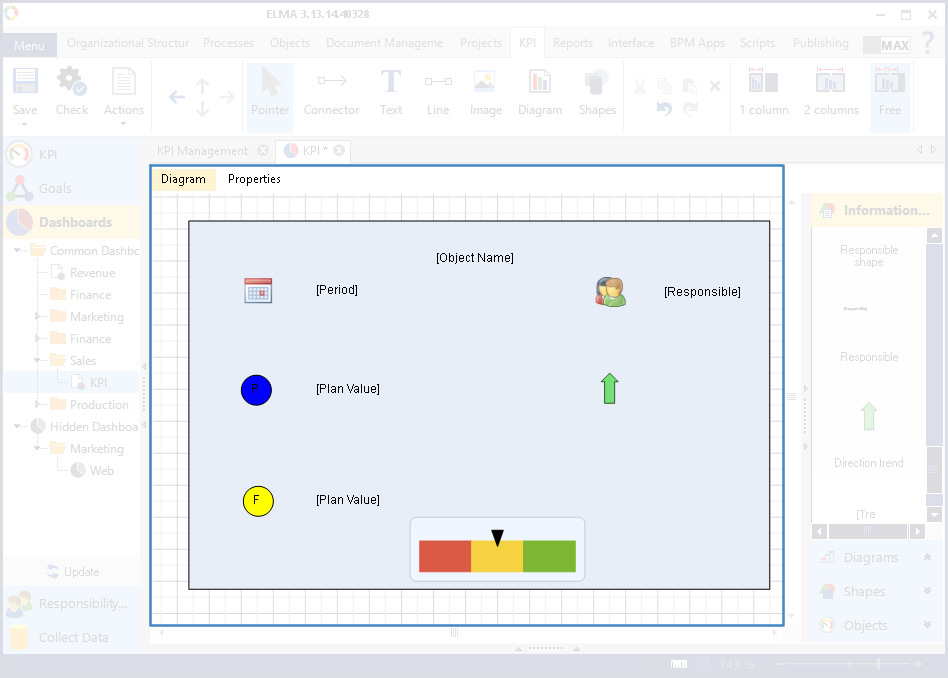
2. Add information elements onto the created and configured rectangle. They will display the necessary information in the web application. In our example these are: Object name, Period shape, Period, Plan shape, Plan value, Status, Fact value, Responsible shape, Responsible, Trend direction, Trend value%, Scale (fig. 4).
Fig. 4. Creating a KPI display template. Added information elements
3. Information elements displaying the KPI value must be bound with the matching indicator. In our example these elements are: Object name, Period, Plan value, Fact value, Responsible, Trend direction, Trend value%, Scale.
Such elements as Period shape, Plan shape, Status, Responsible shape, Trend direction are images and do not change when indicator values change, this is why they do not need to be bound with a KPI model object.
4.
Publish the KPI model. The created KPI display template will be shown in the web application in the
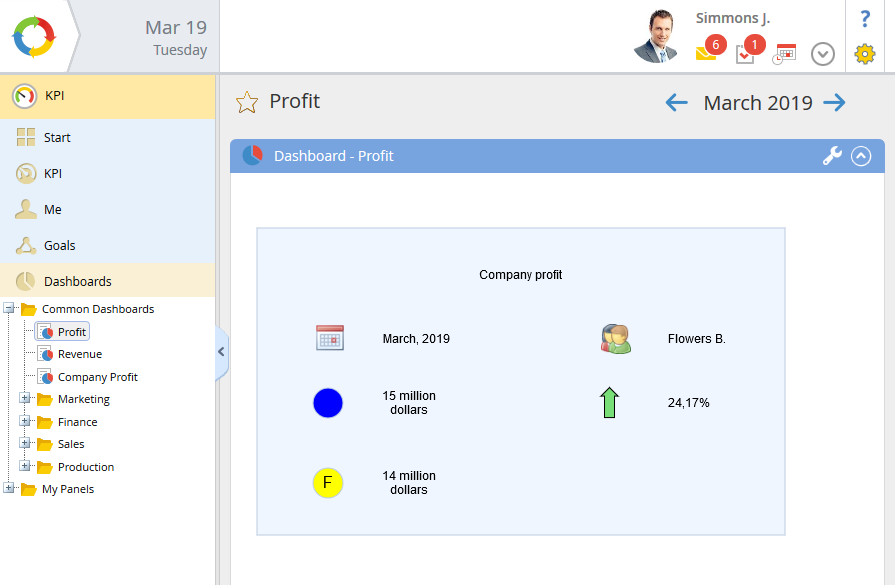
KPI-Dashboard section on the corresponding dashboard (fig. 3)
Fig. 3. Template for displaying a KPI in the web application
Copyright © 2006–2019 ELMA

