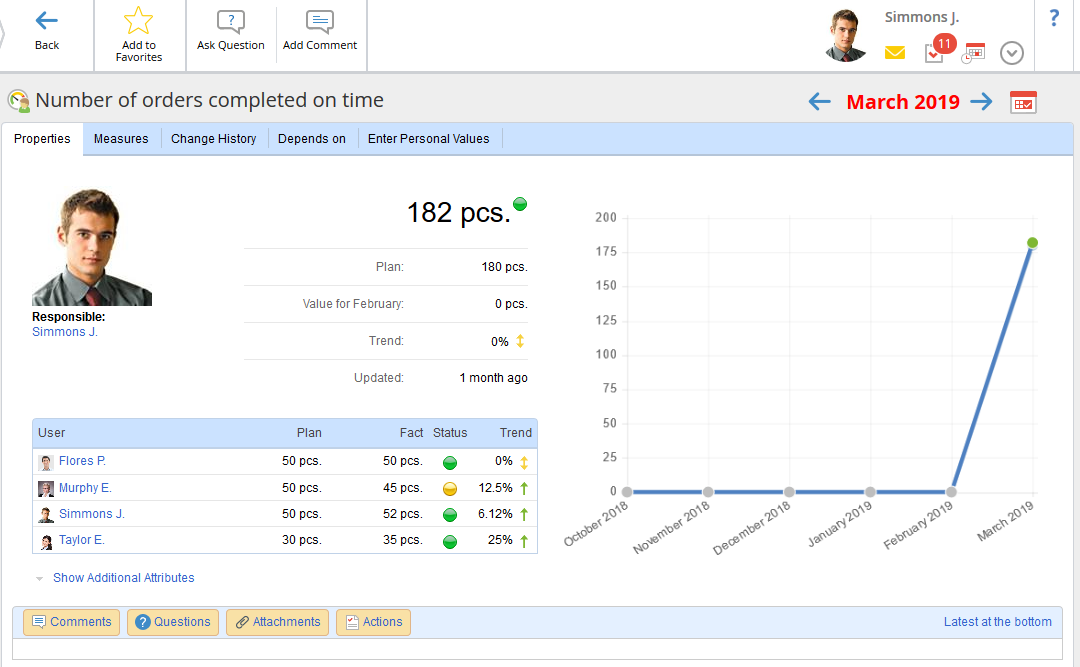
This tab (fig. 1) features all the basic information about a KPI. Logically the information can be divided into four sections (fig. 2):
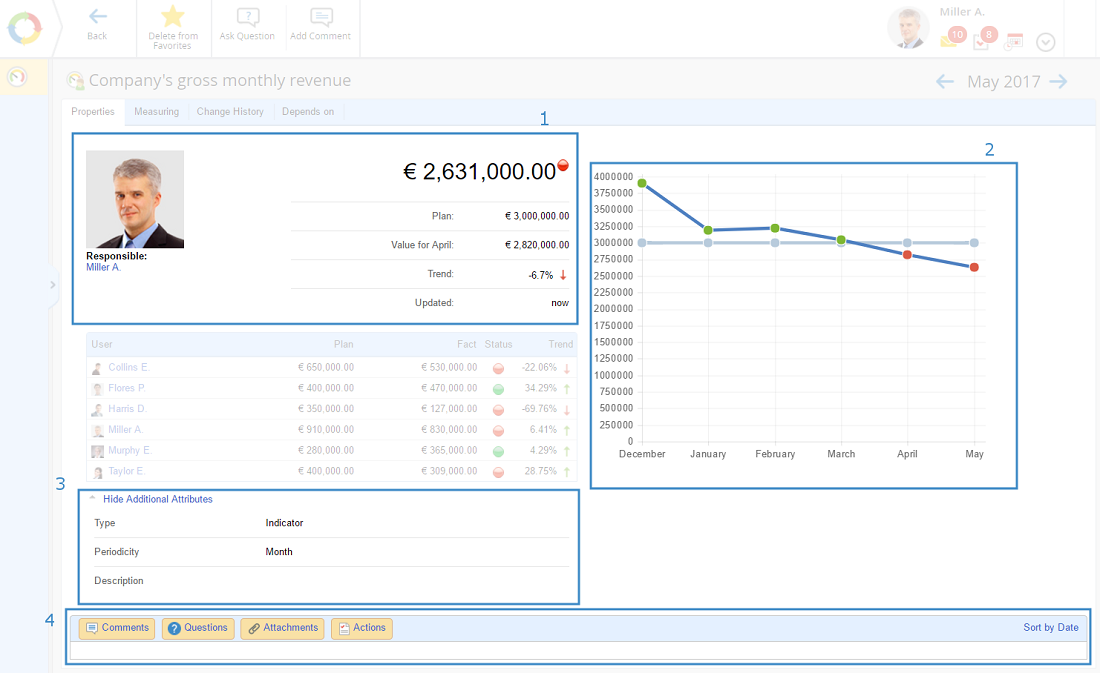
Fig. 2. KPI page. Properties tab
General information (fig. 2, number 1):
full name and photo of the employee who is responsible for the KPI. If in ELMA there are no employees who occupy this job position, then this field will only feature the name of the job position;
current KPI status: – below plan value, – within the limits of plan value, – above plan value. If the status is not defined (that is, the plan and/or fact value in the current or previous period is not specified) then these icons do not appear;
fact value in the current period;
plan value in the current period;
fact value in the previous period;
KPI trend – incline or decline of a KPI in reference to the previous value, in percentages. The decline is shown with the icon, and the incline is shown with the icon. If the trend is not determined (that is, the plan and/or fact value in the current or previous period is not specified)) you will see "0%" and the icon;
the date of the last KPI update;
2. Chart that shows the dynamic pattern of changes in the fact values of the KPI (fig. 2, number 2):
shows the changes of the KPI's fact values over the last six periods (day, week, month, etc). The values are highlighted red, yellow or greed depending on their status at a certain period. Also, the chart shows the dynamics of changes of the KPI's plan value;
3. Additional information on the KPI (fig. 2, number 3):
this section displays: the type of the KPI's, the input periodicity and a brief description. By default, this section is collapsed and is named Show Additional Attributes. To view the contents of this section, click on its name;
4. KPI history (fig. 2, number 4).
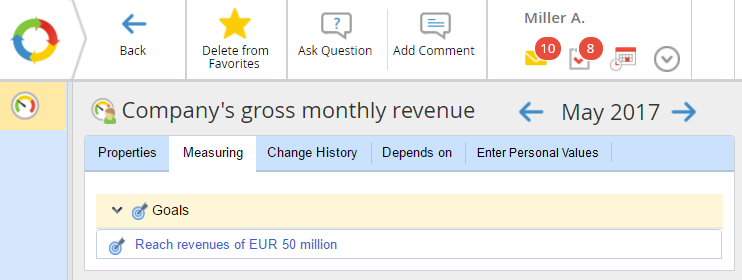
Measuring tab
This tab (fig. 3) shows a list of goals that the current user has influence on.
Fig. 3. KPI page. Measuring tab
When you click on the goal's name, its page opens.
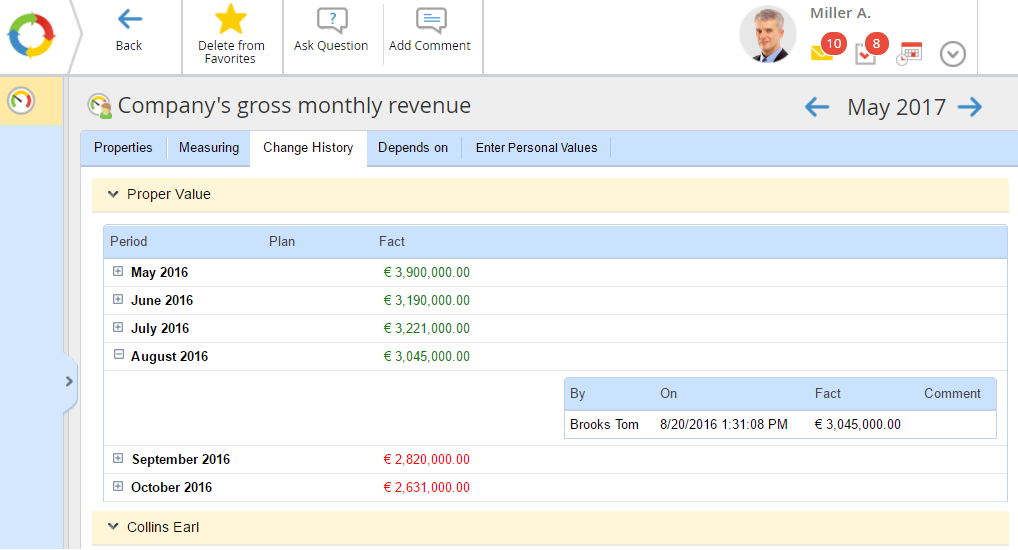
Change History tab
This tab (fig. 4) features a table with a list of all the introduced values of the KPI grouped by the last six periods. All the values are attributed with a certain color :
red – below plan value;
yellow – within the limits of plan value;
green – above plan value.
Fig. 4. KPI page. Change History tab
By default, all the periods are collapsed. To the right of each period, the plan or fact value as well as respective comments can be displayed.
To see the values over a certain period, click . To collapse the values, click .
Each period group contains one or two tables that display the users, who changed the plan or fact values, date and time when they were changed, the specified value and the user comments.
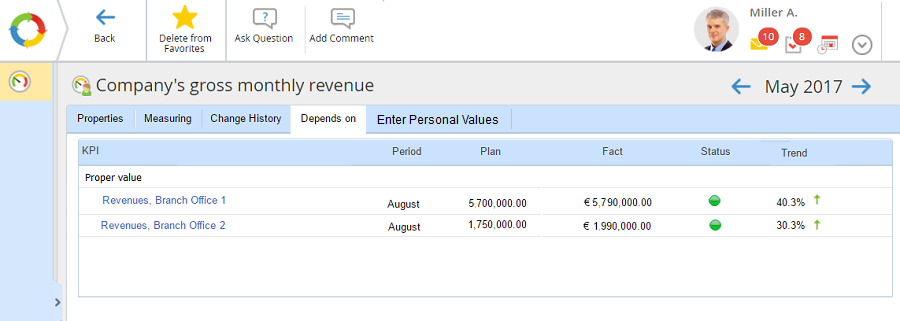
Depends on tab
This tab (fig. 5) shows a table with a list of all other indicators on which the value of the current KPI is dependant.
Fig. 5. KPI page. Depends on tab
To the right of each KPI you can see the following information: the period under review, plan and fact value, status and trend. To open the KPI's page, click on its name.
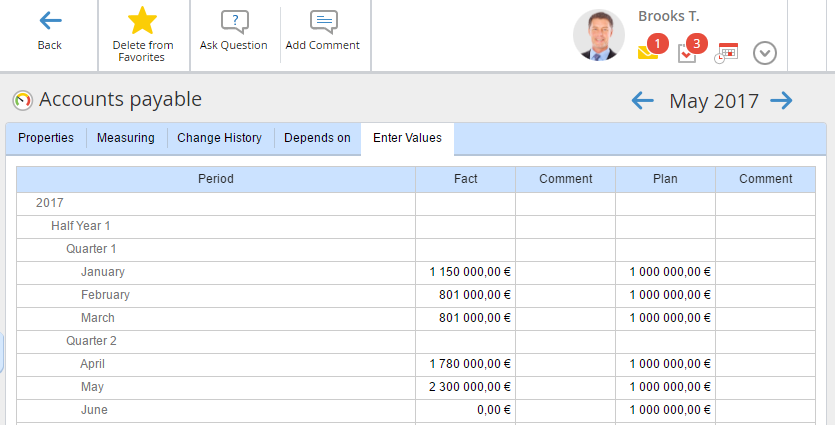
Enter Values tab
This tab (fig. 6) shows a table with a list of the plan and fact values of the KPI displayed by periods (months) over the the current year. This tab is available only if it is set up in ELMA Designer and if the user has corresponding access permission.
Fig. 6. KPI page. Enter Values tab
Display of KPI values on the Enter values tab
The plan and fact values can have the following color:
black for the values that can be changed;
grey for the values that cannot be changed.
2. To introduce a KPI fact or plan value, click on the plan/fact value that you want to introduce.