Help
ELMA KPI
|
|||||
|
|||||


|
|
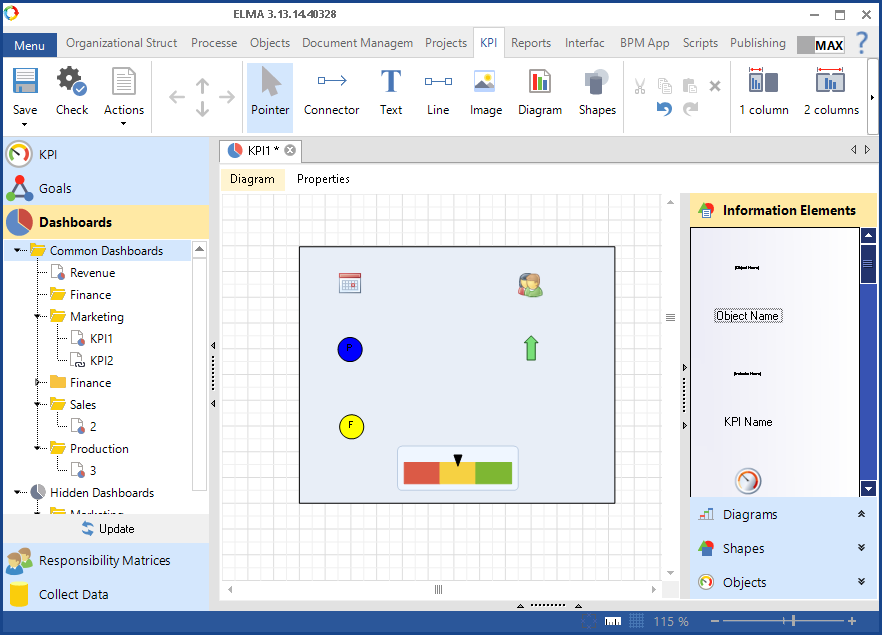
It allows you to move objects across a diagram, resize them, and select objects (for example, to delete them).
|
 |
Add a connector from one element to another. To learn more about connectors, see the respective Help page.
|
|
|
Placing text on a diagram.
To place some text, select a rectangular area in which the text will be located. Then select the Pointer, double-click inside the selected rectangular area and enter the text.
|
 |
Placing a line on a diagram.
To do this, place the mouse cursor at the beginning point of the line on the diagram, press the left mouse button and while holding it down, draw a line.
When you choose this mode, on the top toolbar the following buttons will be displayed:
If necessary, choose line width dash style. In order to see the changes, switch the cursor to the Pointer and click on any place inside the sheet.
|
 |
Insert an image into a diagram. When you click this button, an image selection window will open. The image will be added to the diagram.
|
 |
When you click this button, the Diagram unit will open.
|
 |
When you click this button, the Shapes unit will open.
|
 |
Element edit panel.
In order to apply these actions to an object, it must be selected with the Pointer tool.
|
 |
Choose the diagram width.
|
|
|
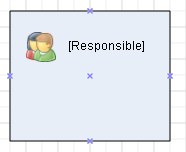
When you click this button, the ports that connect diagram objects will be shown/hidden (fig. 4). Each diagram object has several ports.
 Fig. 4. Diagram object ports
|
|
|
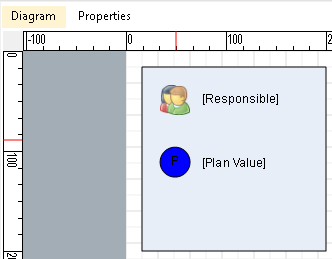
When you click this button, at the top of a diagram a ruler will be shown/hidden (fig. 5). It helps to place elements on a diagram as accurately as possible.
 Fig. 5. Ruler
|
|
|
Show/Hide grid. See the respective Help page to learn more about the grid.
|
|
|
Panel scale. See the respective Help page to learn more about the panel scale.
|