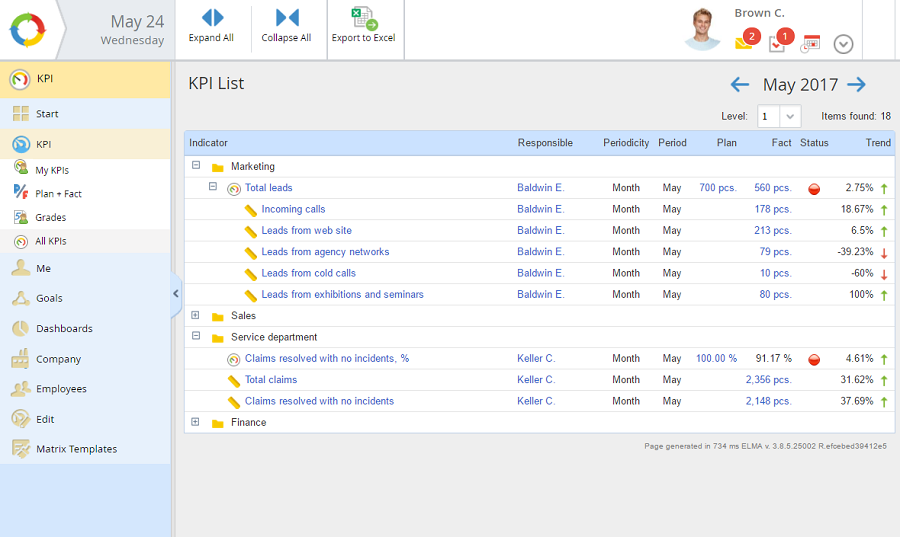
This section (fig. 1) shows a list of all the KPIs in the system, and displays the related information over a selected period (plan and fact values, status, etc.). Also, it is possible to change KPI values, view their pages and export the KPI list as an Excel file.
Fig. 1.All KPIs section
There are two ways to open the All KPIs section:
KPI – Company;
KPI – KPI – All KPIs.
Access to this section is managed by the administrator in Administration – KPI – General Access Settings – Allow to view all KPIs. If a user does not have these access permissions, he or she will only see the following KPIs on this page:
indicators in the personalization of which he/she participates;
By default, all the values in the table are collapsed.
To collapse the list you can either click or change the nesting level to a smaller one.
You can expand the list by clicking or by changing the nesting level. For that, in the Level drop-down list select the number of the level until which you want the values to be shown. After that, the page will show a list of KPIs expanded up to the selected nesting level. To view all the KPIs, select 10, the maximum nesting level.
Use the buttons in the top menu to fully expand/collapse the tree.
Table columns
Indicator – name of an indicator or a group of indicators. To the left of the indicator there is an icon specifying its type ( – KPI; – metric; – row object KPI, row KPI value; – row object metric, row metric value; – personal KPI, – personal metric; - personal value of a KPI/metric; - group of KPIs). When you click on an indicator's name, its page opens.
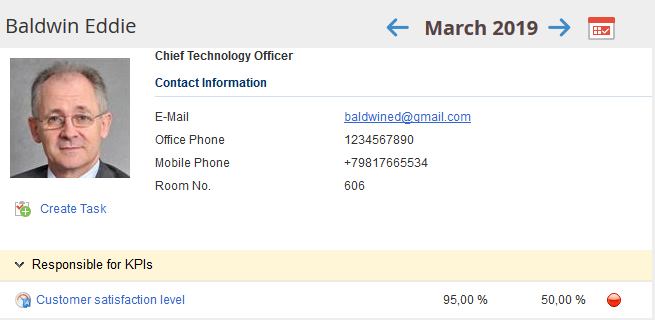
Responsible – an employee responsible for this indicator. If you click on the employee name, their contact information (fig. 2) will open as well as the list of KPIs and goals they are responsible for. In the opened dialog box you can also assign a task to this user. If no user is assigned to the job position selected in ELMA Designer, or if a group of employees was specified as responsible for a personal KPI, this column will display only the name of the chosen job position (fig. 1).
Fig. 2. Page with a list of KPIs and goals which the user is responsible for and/or supervisor of
Periodicity – periodicity of value update (For example: Day, Week, Month, etc.)
Period – period over which the data is displayed.
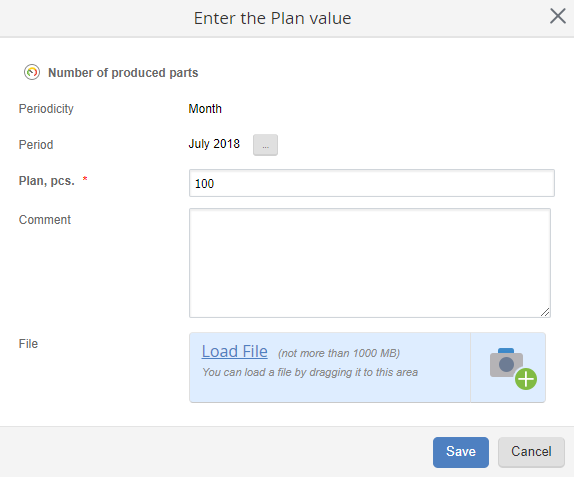
Plan – indicator's plan value. If the KPI values are entered manually, and you have permissions to enter values, then when you click on a value in this column, a dialog box will open where you enter a value and click Save (Fig. 2). After making changes, the respective cell will be highlighted yellow. Note, that it is highlighted only until you refresh the page. To learn more about changing planned KPI values, read the respective Help article.
Fact – indicator's fact value. For more information on changing the fact value see a respective Help section. If the KPI values are entered manually, and you have permissions to enter values, then when you click on a value in this column, a dialog box will open where you enter a value and click Save (Fig. 2). After making changes, the respective cell will be highlighted yellow. Note, that it is highlighted only until you refresh the page. To learn more about changing fact KPI values, read the respective Help article.
Fig. 3. Dialog box for entering KPI value
Status – indicator's status: – below plan value, – within the limits of plan value, – higher than the plan value, – the value cannot be defined (if the plan and/or fact value is not specified).
Trend – growth and decline of the value in reference to its previous value in percentage. The trend is marked by one of the following icons: – decline; – growth; – the trend is not defined (if the plan and/or fact value is not specified in the current period or the previous period).
Display of KPI values
1. Plan and fact values of an indicator can have the following colors:
the values that can be changed are blue;
the values that cannot be changed are black.
2. Plan and fact values of an indicator can have the following graphic symbols:
the "-/-" indicates the values for which the default value was not specified in ELMA Designer, and the value was not entered for the viewed time period.
To enter the value of an indicator, click on the plan/fact value that you need to enter.