How to Work with Diagram Elements
You can perform the following actions with the elements on a dashboard diagram:
Adding elements to a diagram
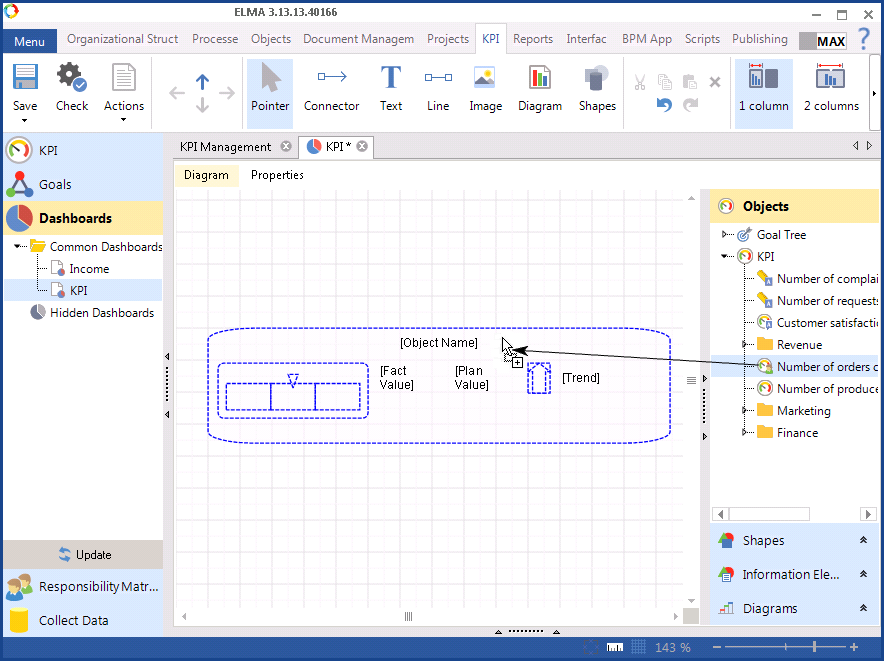
Elements are added to a diagram with the help of the drag-n-drop technique, i.e. grabbing (by pressing and holding the left mouse button) the desired element and dragging it from the panel of elements into the diagram area (fig. 1).
Fig. 1. Adding an element to a diagram with the help of drag-n-drop
Selecting diagram elements
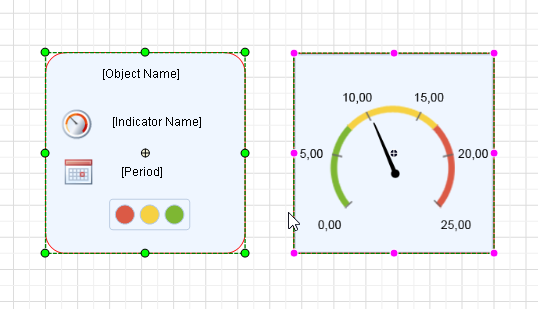
In order to select a diagram element (fig. 2), choose the Pointer tool on the top toolbar, point at the desired element and left-click on it.
Fig. 2. Selected element of a dashboard diagram
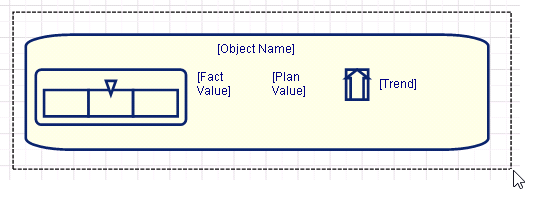
In order to select several elements at once, press the Ctrl key on your keyboard and while holding it down, select the required elements by moving the cursor and clicking on them. Also, if you cover the area of the modeling sheet, holding down the left mouse button, all the elements inside this area will be selected (fig. 3).
Fig. 3. Selected group of elements on a dashboard diagram
While you are selecting elements, they are highlighted in blue (fig. 4). The elements that have already been selected are highlighted in red (fig. 2).
Fig. 4. Element of the toolbar diagram falling into the selection area
Connecting diagram elements
To connect dashboard diagram elements, click the Connector button on the top toolbar, and then hover the mouse pointer over the element from which you want to create a transition. The element icon will display the ports where you can place the beginning of the transition. When you hover the mouse pointer over a port, it becomes a red square (fig. 5). To create a transition, left-click and while holding the mouse button down, draw a connecting line to the port of the corresponding element.
Fig. 5. Connecting two elements on a dashboard diagram
Moving elements on a diagram
In order to move an element,
select it and while holding the left mouse button down, move it to the desired area of a diagram. To move elements more accurately, you can use arrow keys on your keyboard.
Resizing elements on a diagram
In order to change the size of an element,
select it and resize it by dragging and moving one of the green markers along the perimeter of the element.
To resize elements more accurately, you can hold down the Ctrl key on your keyboard and resize an element by pressing arrow buttons.
Deleting elements from a diagram
To delete an element from a diagram,
select the desired element and use one of the methods:
-
Press the
Delete key on your keyboard;
-
-
Choose
Delete in the context menu of the chosen object.
Element context menu
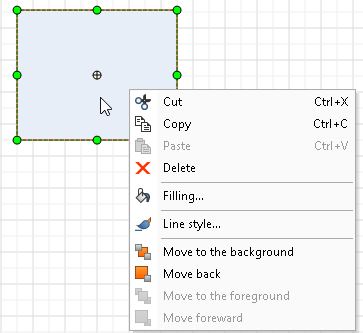
Context menu contains a list of commands that allow you to perform certain actions on a chart element. The context menu varies depending on the element type.
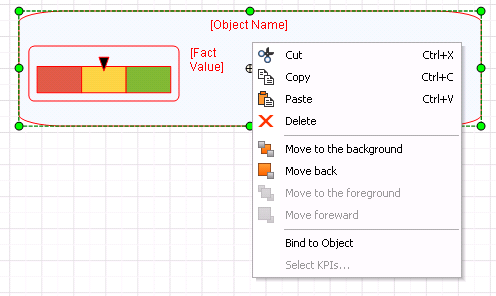
In order to open the context menu (fig. 6),
select an element and right-click on it.
Fig. 6. Context menu of a dashboard diagram element
Cut – delete an element from the diagram by creating its copy in the clipboard.
Copy – create a copy of an element in the clipboard. In this case, all properties and attributes of the element are also added to the clipboard. The original element remains unchanged.
Paste – insert an element into the diagram, a copy of which was previously added to the clipboard.
Delete – delete an element from the diagram.
Move to the background – position the element behind all the elements of the diagram.
Move back – move the selected item 1 level lower.
Move to the foreground – position the element in the foreground.
Move forward – position the element over one element.
Bind to object – bind an element with an object of the KPI model (
indicator or
goal). Only the following elements can be bound with the objects:
Information elements and Indicator Value (from the Diagram Unit). To learn more about how to bind elements with KPI model objects, see the
respective Help page. This menu item is not available for the
Shapes.
Select KPIs… – The information about the selected KPI will be displayed in the web application. This menu item is available only for the elements of the
Diagram unit. To learn more about selecting KPIs, see the
respective Help page. This menu item is missing for the elements of the
Shapes unit.
For the elements of the
Shapes unit, the context menu has 2 additional items —
Filling... and
Line style... (fig. 7). To learn more about these items, see the
respective Help page.
Fig. 7. Context menu of the Shapes unit element
Copyright © 2006–2019 ELMA

