Help ELMA Projects+
×
Menu

Project Plan Page

There are two ways to open the project plan page:
Only users with the respective access permissions can work with this section. Access permissions to edit the project plan are assigned by the project administrator, manager or supervisor on the required project page, by clicking Actions – Access Permissions .
Fig. 3 shows an example of the Project Plan page.
Fig. 3. Projects section. Project Plan

Top menu buttons

Go to the current project page.
Publish the current project plan version. This button is available only in the Draft project plans.
Send the project plan version for approval. This button is displayed only if the respective settings are configured in the project type.
Go to the project plan editing page.
When you click Actions or a drop down menu opens, which allows you to:
 
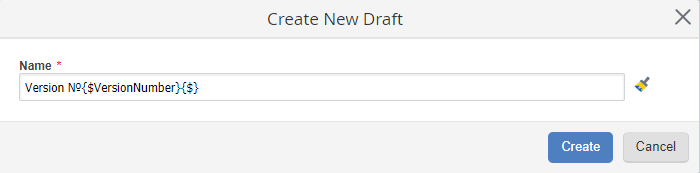
When you create a draft or copy the project plan to a draft, a dialog box for entering the draft name opens (fig. 4). For convenience, the draft name is generated by a template, configured in the project type.
Fig. 4 Creating a new project plan draft
Click   to open a dialog box with the list of available variables.
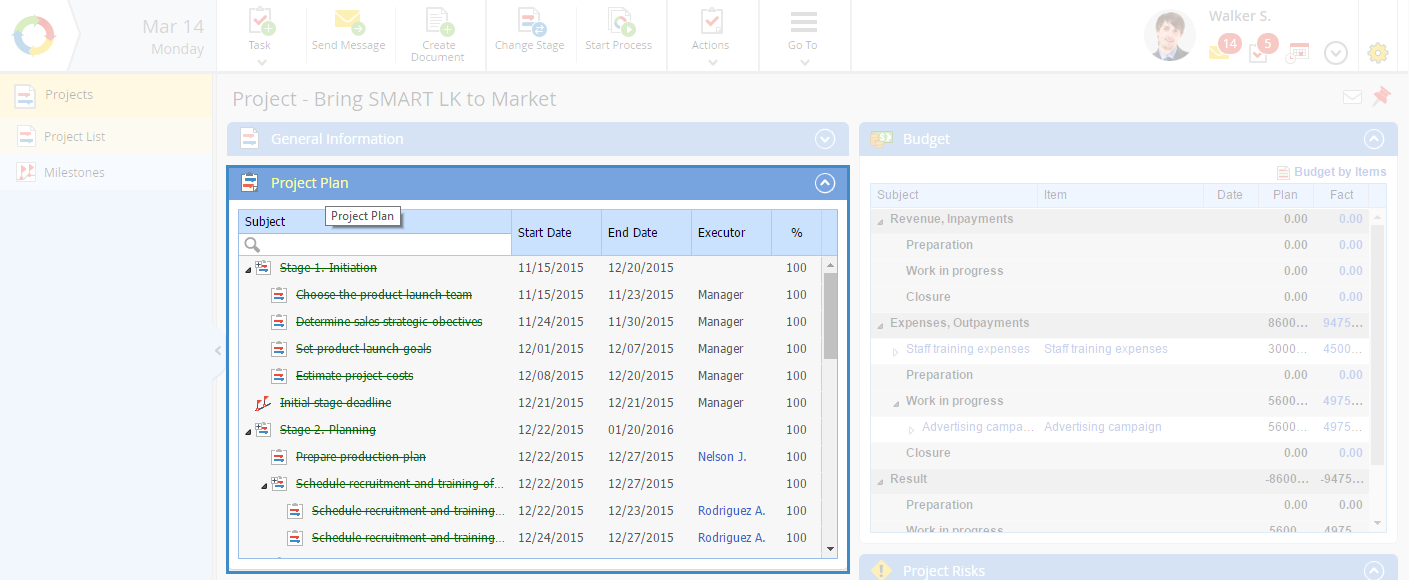
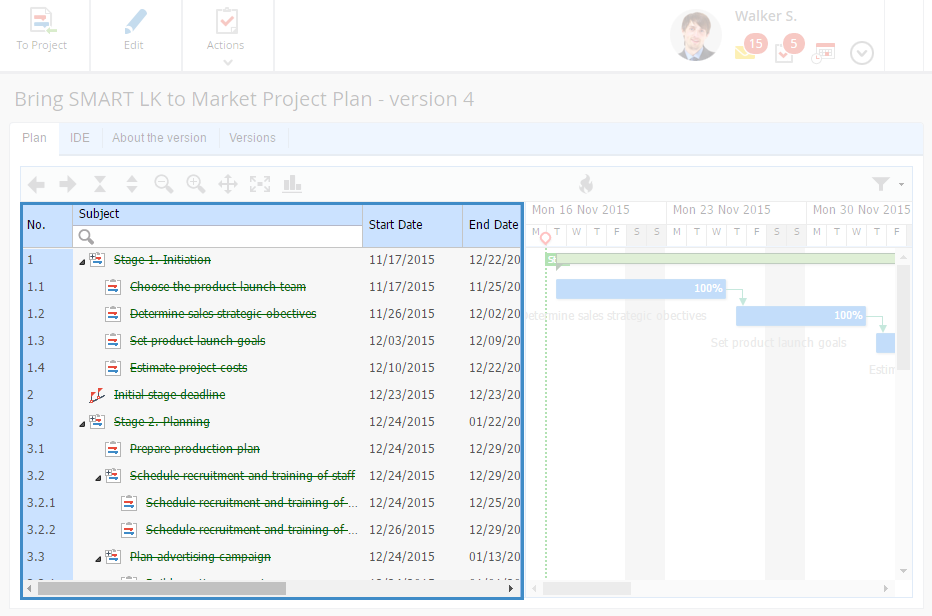
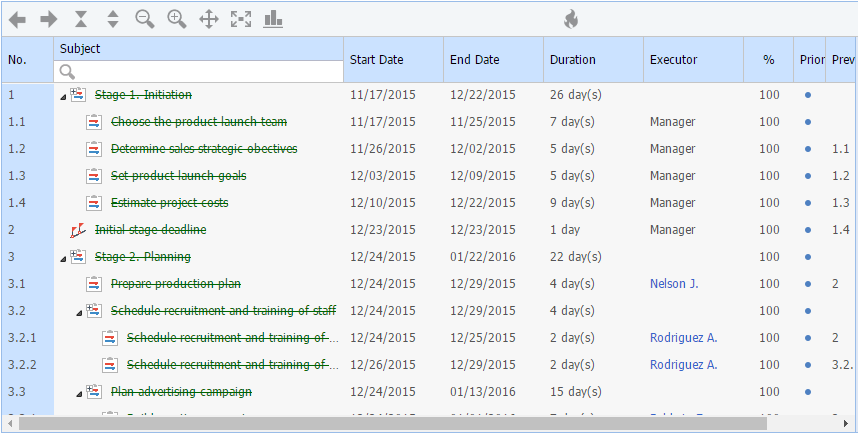
Tabs of the project plan page

Project plan page includes the following tabs: Plan , WBS, About the version , Versions . The active tab is white.
Plan tab
This tab displays (fig. 3):
List of project plan tasks
All the project plan tasks are in a table (fig. 8) in the order, set when creating or editing the project plan.
Fig. 8. List of project plan tasks
By default, this table contains:
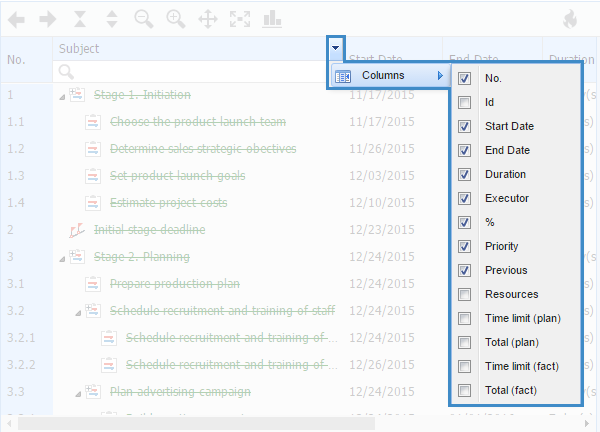
To change the set of columns in the table, mouse over one of the columns and click to open the menu (fig. 8) for configuring the set of table columns. Check/uncheck the boxes next to the columns you want to show or hide.
Fig. 9. Table columns settings menu
The set and width of columns is configured in the project type template.
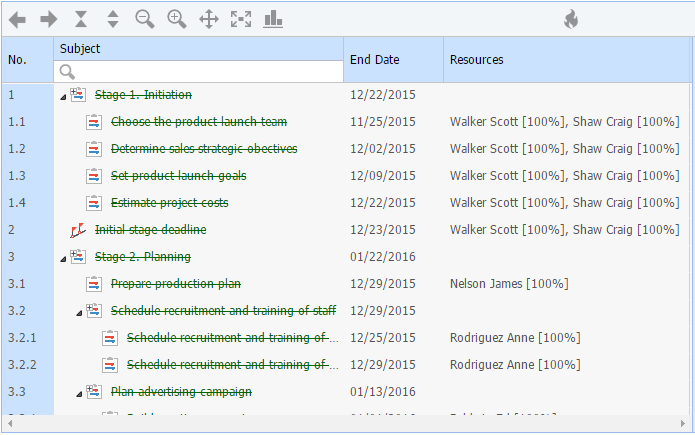
The Resource column is used for monitoring the resources load. This feature is handy when planning resource (technical, human, material) distribution. This column (fig. 10) displays the load of the human, technical and material resources.
Fig. 10. Resources load
The Time limit (plan/fact) columns display the planned and fact time limit values for each project plan task.
The Total (plan/fact) columns show the total time limit values on each parent task. Note, that time limits are not accounted for stage tasks.
Project plan toolbar
Shift the Gantt chart one interval right/left.
When you click on this button, a menu opens, that allows quickly navigating in the Gantt chart:
  • Current Period – go to the current period;
  • To project start – go to the project start date;
  • To project end – go to the planned project due date;
  • Select interval… – go to a specific period. Select the period start and end date (fig. 11).
Fig. 11. Selecting an interval
Collapse/expand all.
Zoom in/out the Gantt chart.
Auto-zoom the Gantt chart.
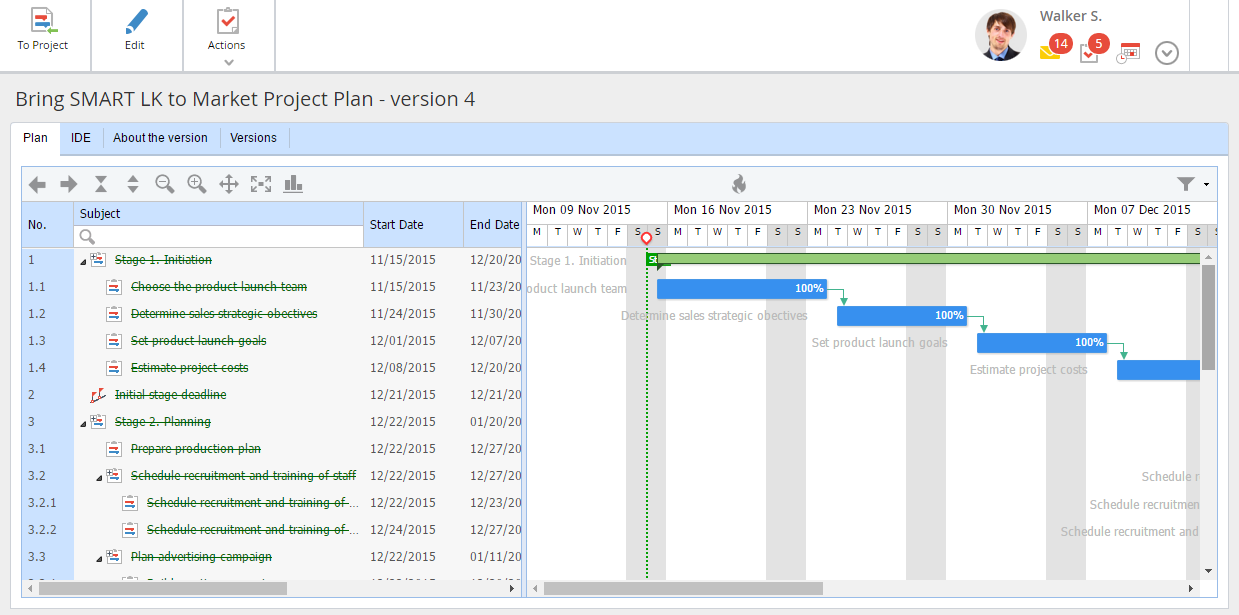
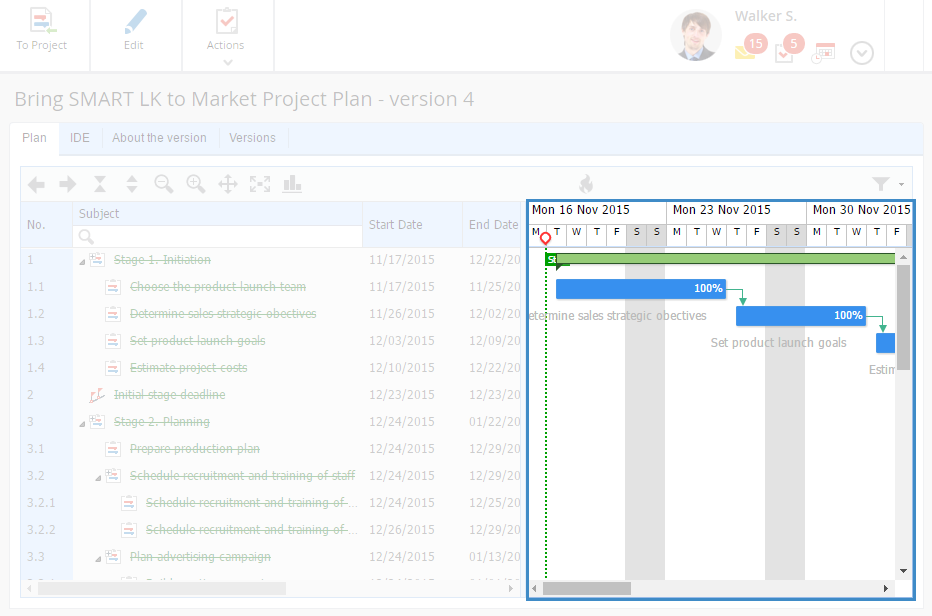
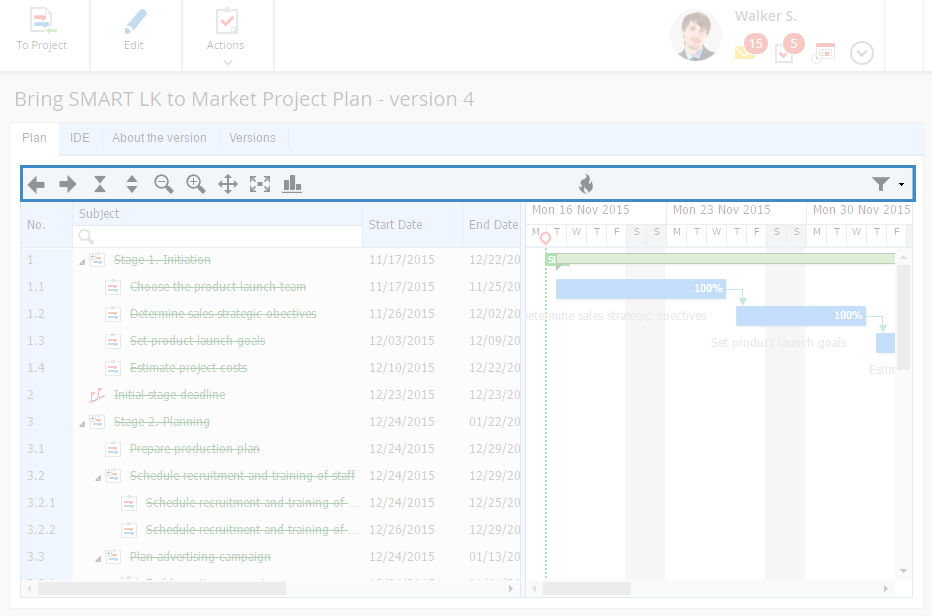
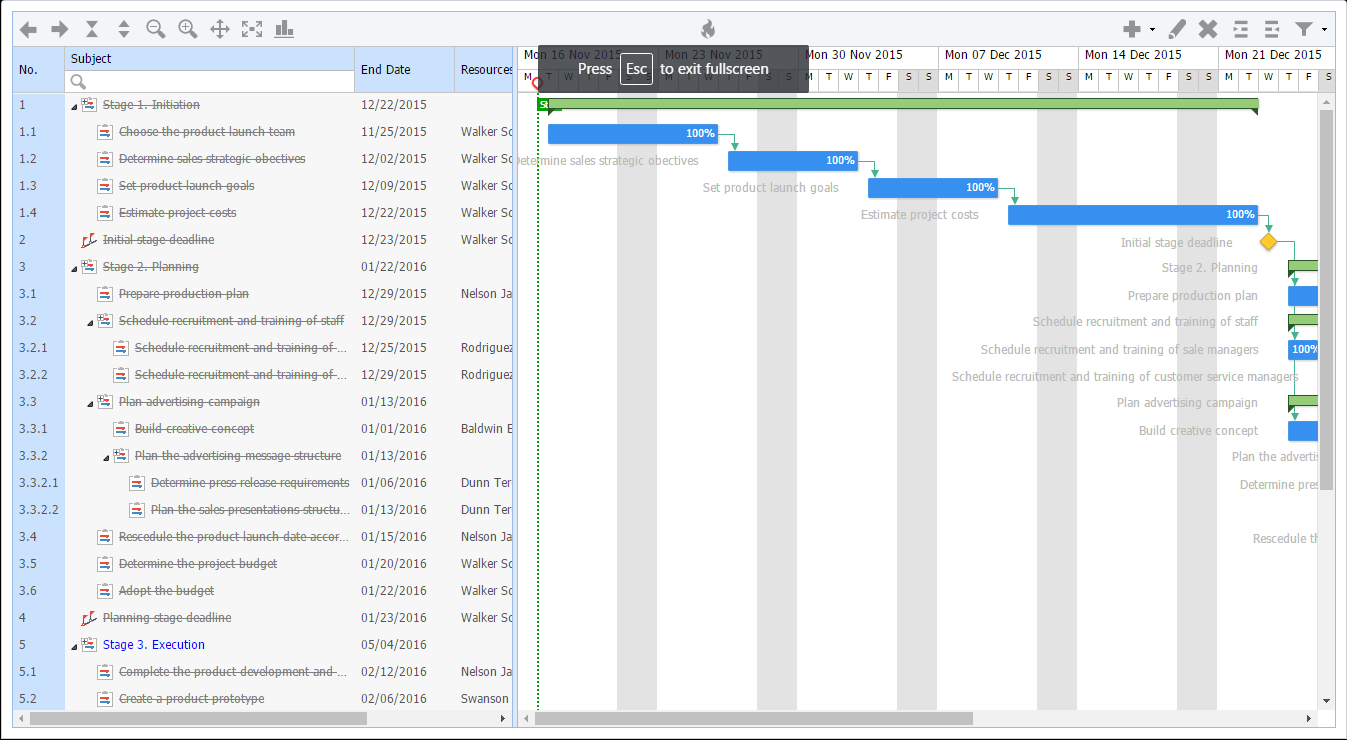
Switch the project plan to full screen mode (fig. 12). To exit the full screen mode, press ESC on your keyboard.
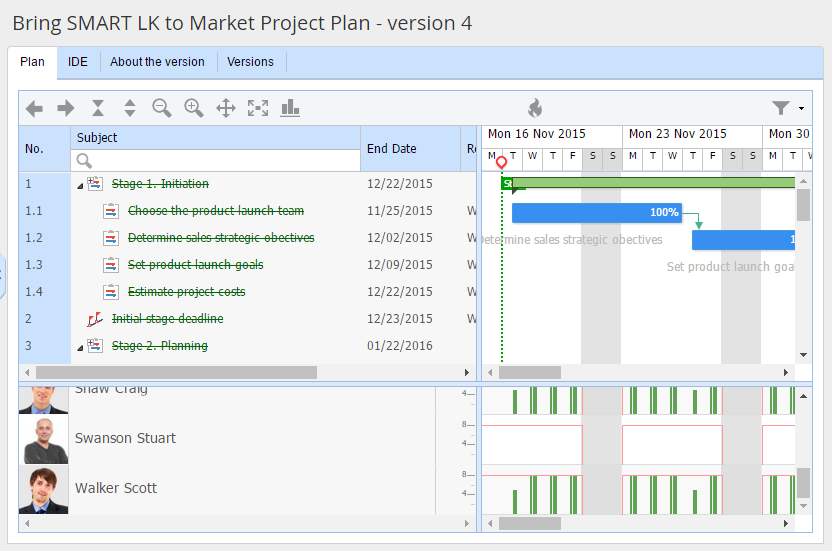
Show/hide the resource workload bar chart (fig. 13). This bar chart is displayed at the bottom of the project plan page.
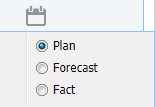
Click on this button to switch between different Gantt chart display modes:
  • Plan – display tasks on the chart according to their planned dates;
  • Fact – display tasks on the chart according to their actual dates. If the fact of starting the execution was not specified for a task, the planned dates will be used. However, if planned start date is later than the actual end date, the actual start and end dates will be used;
  • Forecast – display tasks on the chart, which have expected due dates.
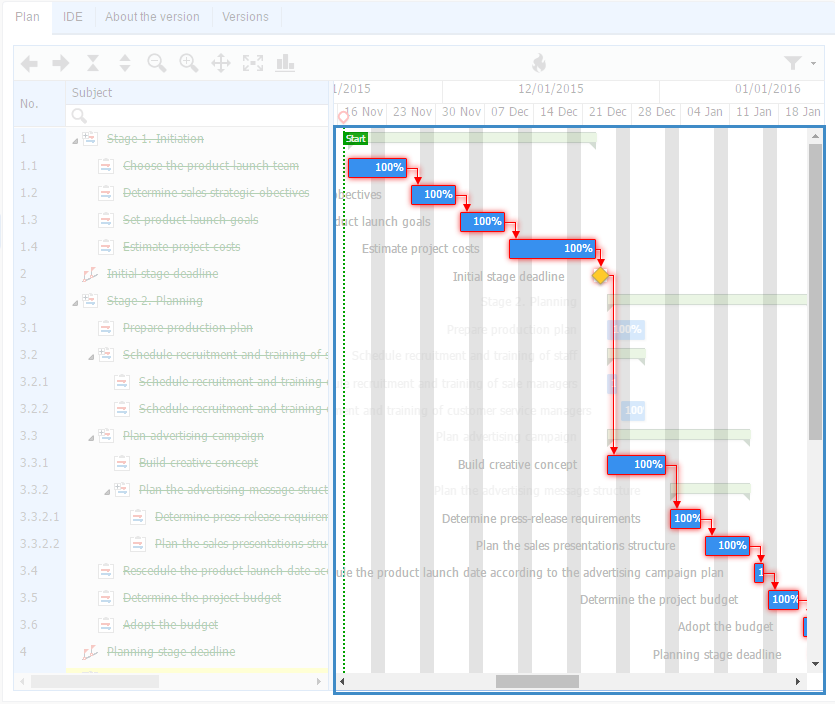
Critical path is one or several tasks, affecting the project end date. When you click this button, all these tasks are highlighted red on the Gantt chart (fig. 12).
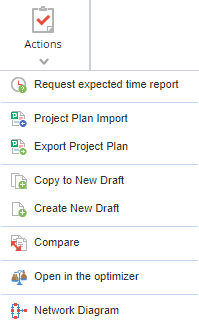
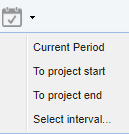
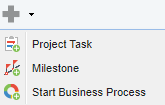
When you click this button, a menu opens, which allows you to create:
Go to the task editing page.
Delete the selected task.
Level up/down the task.
When you click this button, a menu opens, which allows you to:
  • show tasks with duration more than 8 days on the Gantt chart;
  • filter tasks in the list by certain parameters;
  • clear the applied filter;
  • go to the last task in the project plan;
  • Change the plan tasks dates.
If necessary, you can create a custom filter. More information here.
 
Click this button to open a menu, which allows applying filters to the workload barchart:
  • Hide resources of sub-projects – only the resources of the current project plan will be displayed;
  • Show resources of first level sub-projects – only the resources of the first level sub-projects in the current project plan will be displayed;
  • Show all resources of sub-projects – the resources of the current project plan will be displayed along with sub-project (all levels) resources.
Fig. 12. Full screen mode of the project plan
Fig. 13. Resource workload bar chart
Fig. 14. Gantt chart. Critical path

Copyright © 2006–2019 ELMA