Collecting informaiton on deadlock
To collect information on deadlocks, follow these steps.
1. Launch SQL Server Profiler.
2. Create a new trace
2.1. Set up deadlock logging: Events Selection, Deadlock graph event (fig.1).
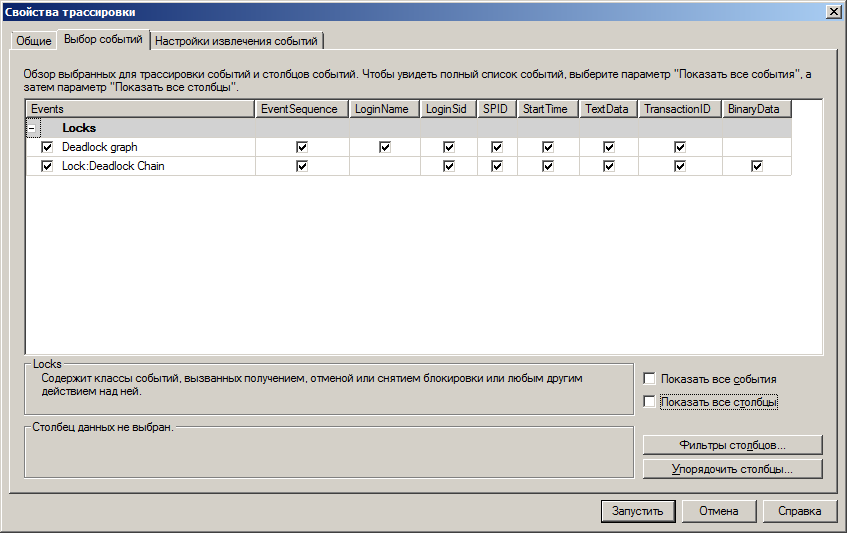
Fig. 1. Events Selection
2.2. Configure the graphs saving: Events Extraction Settings, Save Deadlock XML events separately (fig.2).
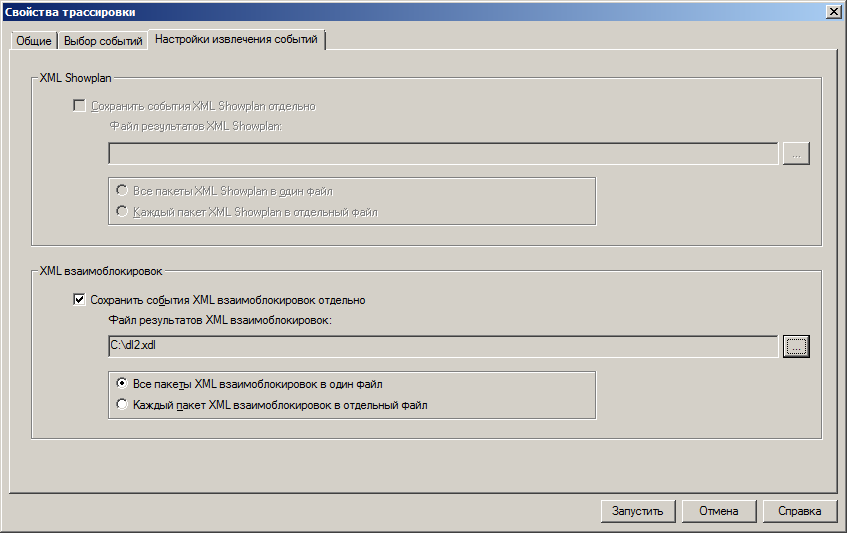
Fig. 2. Setting up saving the deadlock graph
3. Start tracing.
4. After information is collected, stop tracing.
5. The information on the deadlock graphs will be saved in the xdl file, specified in the tracing settings.
Instructions on saving information on deadlocks: