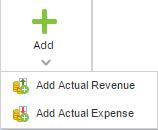
When you click Add or , a drop down menu opens, which allows you to add an actual value of a project revenue expense.
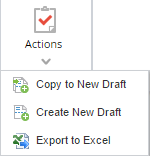
When you click Actions or a drop down menu opens, which allows you to:
1. Copy the current budget version to a new Draft version.
2. Create a new (blank) project budget version.
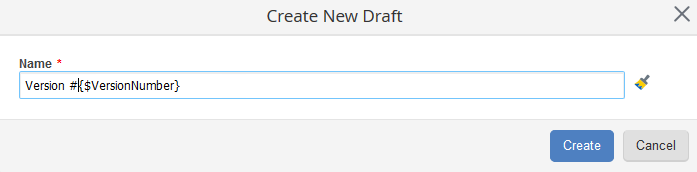
When creating a draft of copying the project budget into a draft, a dialogue box appears where you can enter the name of the draft (fig.4). To make it more convenient, the draft name can be generated from a template that is configured in the project type.
Fig. 4. Create New Draft dialogue box
When you click the button, a dialogue box with available variables opens.
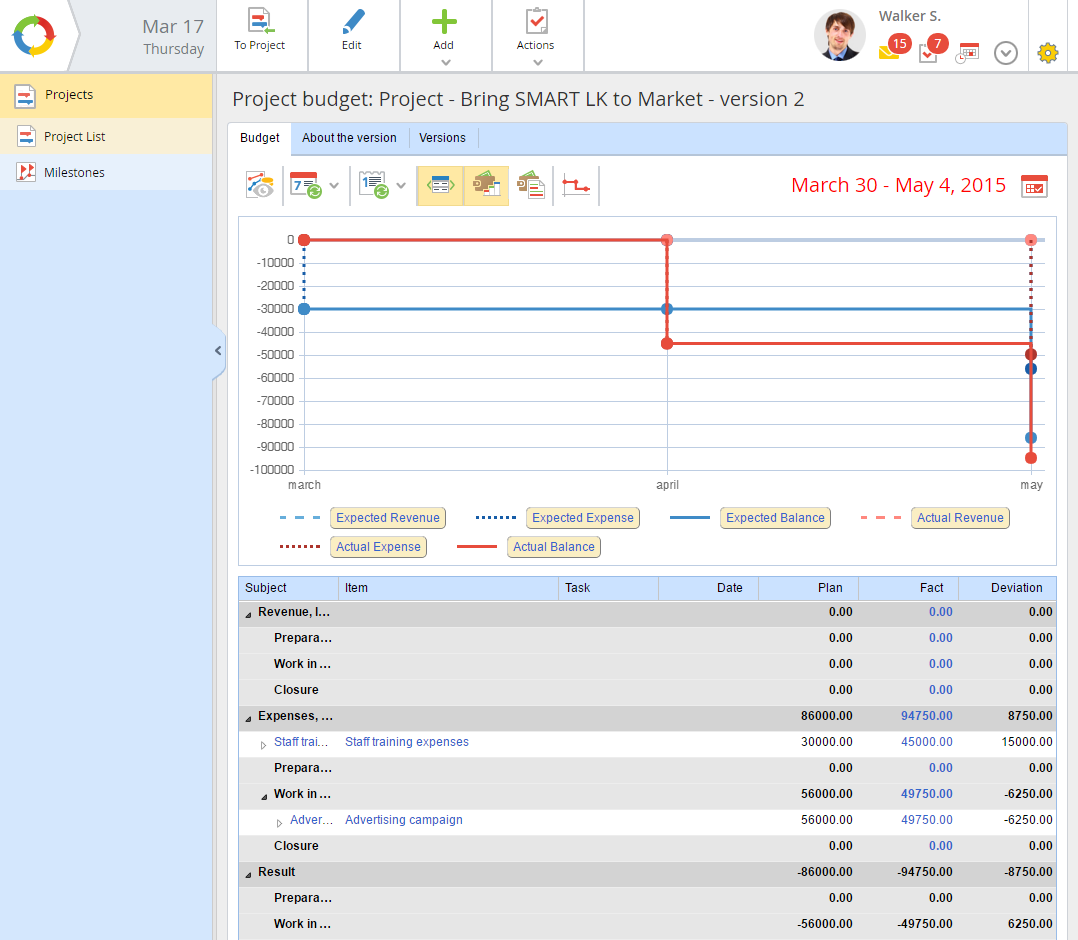
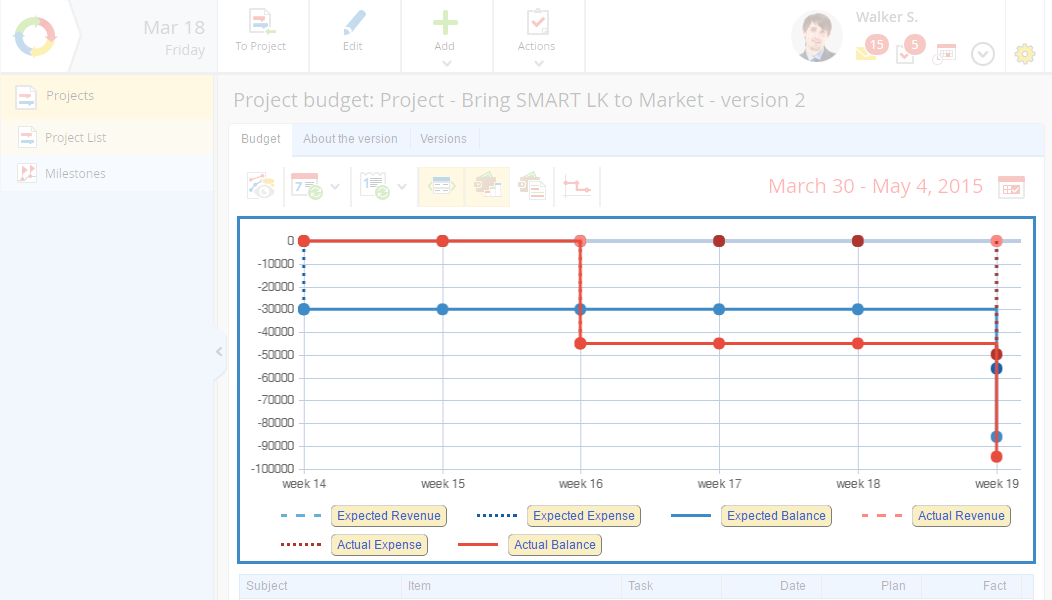
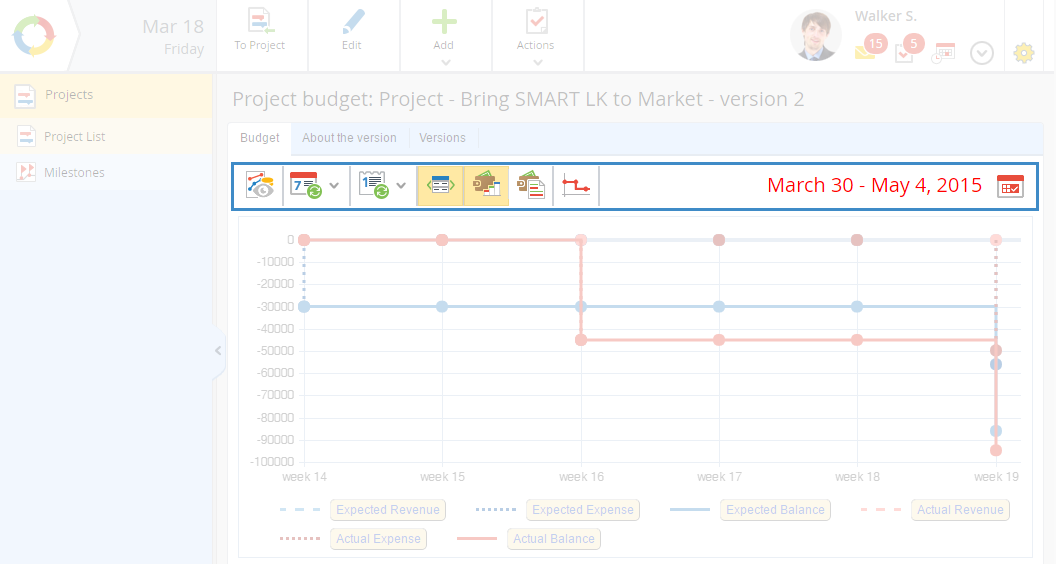
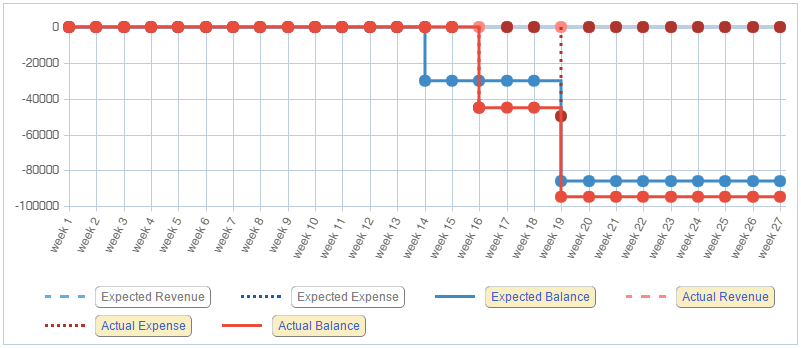
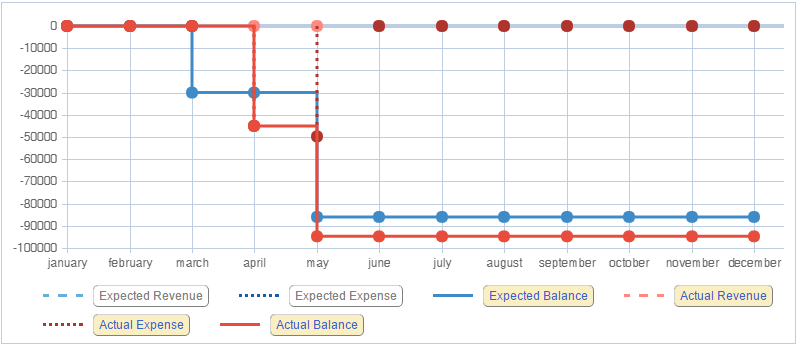
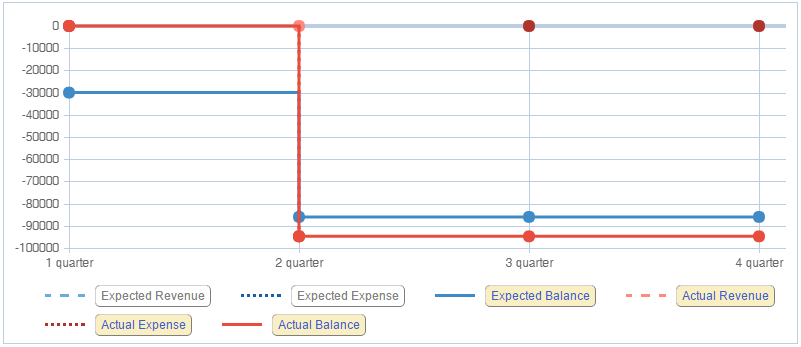
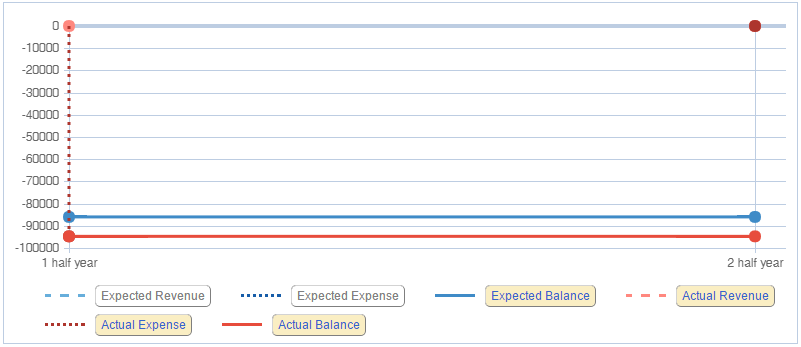
Project budget chart is a graphical representation of fact/plan values of project revenues/expenses over the selected period (fig. 8).
Fig. 8. Project budget chart
The budget chart consists of points (table row values), which are placed along the time axis and connected to each other. Each point represent a separate plan/fact value of the project revenue or expense at a given time. Points from one table row are connected with a dashed or full line of a particular color. These lines reflect the value changes dynamics. The current time is marked on the chart with a green vertical line.
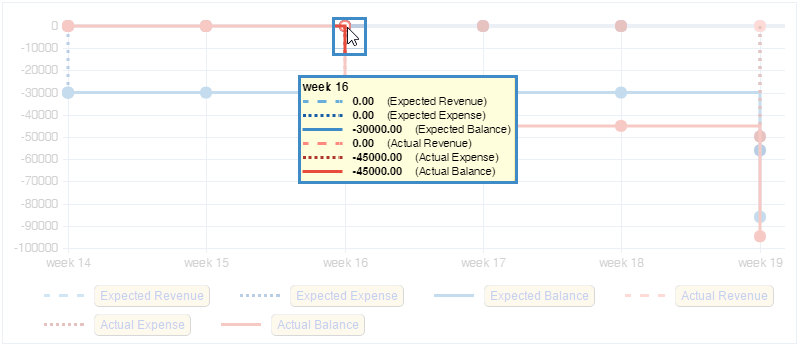
When you mouse over one of the points, a pop-up is displayed. It contains the information on plan/fact values of revenues/expenses on the selected date (fig. 9).
Fig. 9. Project budget chart. Pop-up window
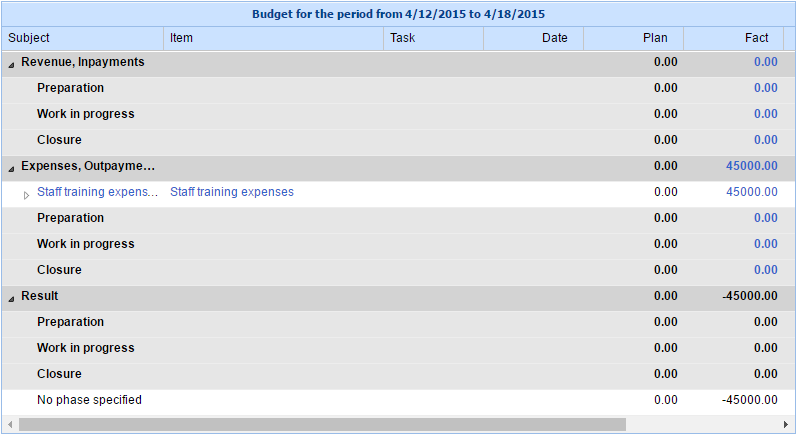
When you click one of the points, the plan/fact value in the table below are filtered for this date (fig. 10).
Fig. 10. Data table. Filtering by date
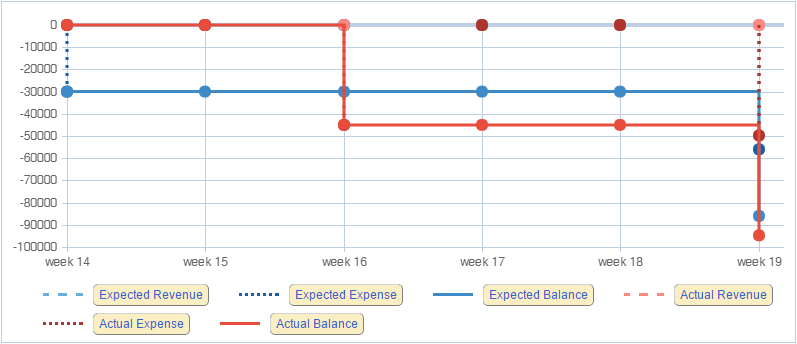
The legend is below the budget chart. It contains the rows headers and their graphic representation on the chart:
Expected Revenue – planned revenue value ();
Expected Expense – planned expense value ();
Expected Balance – planned balance value (). Calculated by this formula: Expected Revenue – Expected Expense;
Actual Revenue – actual revenue value ();
Actual Expense – actual expense value ();
Actual Balance – actual balance value (). Calculated by this formula: Actual Revenue – Actual Expense.
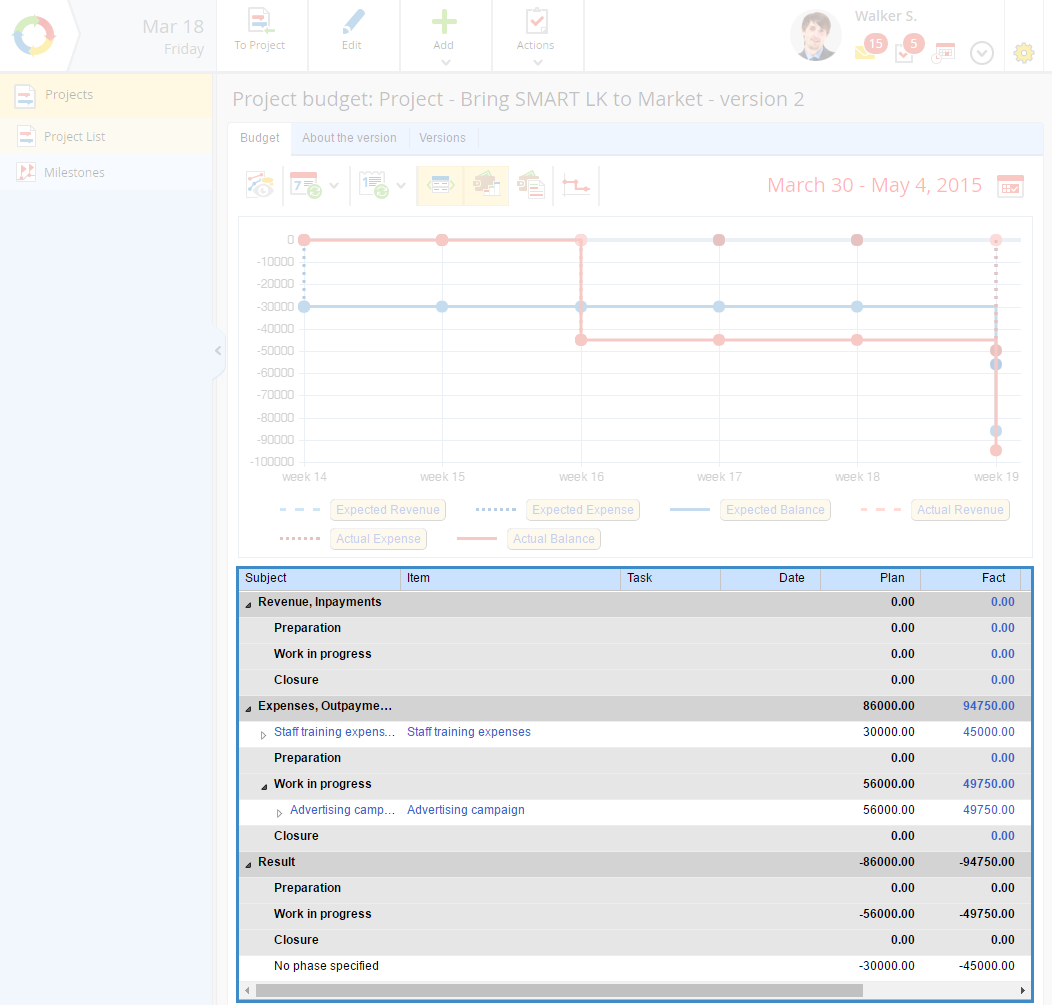
Be default, all the rows are didsplayed in the chart (their names are inside the yellow blocks). You can hide some of the rows on the chart, if necessary. To do so, click the name of the required row in the legend (the selected name will be highlighted grey) (fig. 11).
Fig. 11. Project budget diagram with hidden rows
To change the data display mode of the chart, use the and buttons of the toolbar. To hide the chart, click on the toolbar. After that, the button will look like this and . Click the button one more time to show the chart again. To learn more about budget toolbar, see the respective section.
List of planned/fact values of revenues and expenses
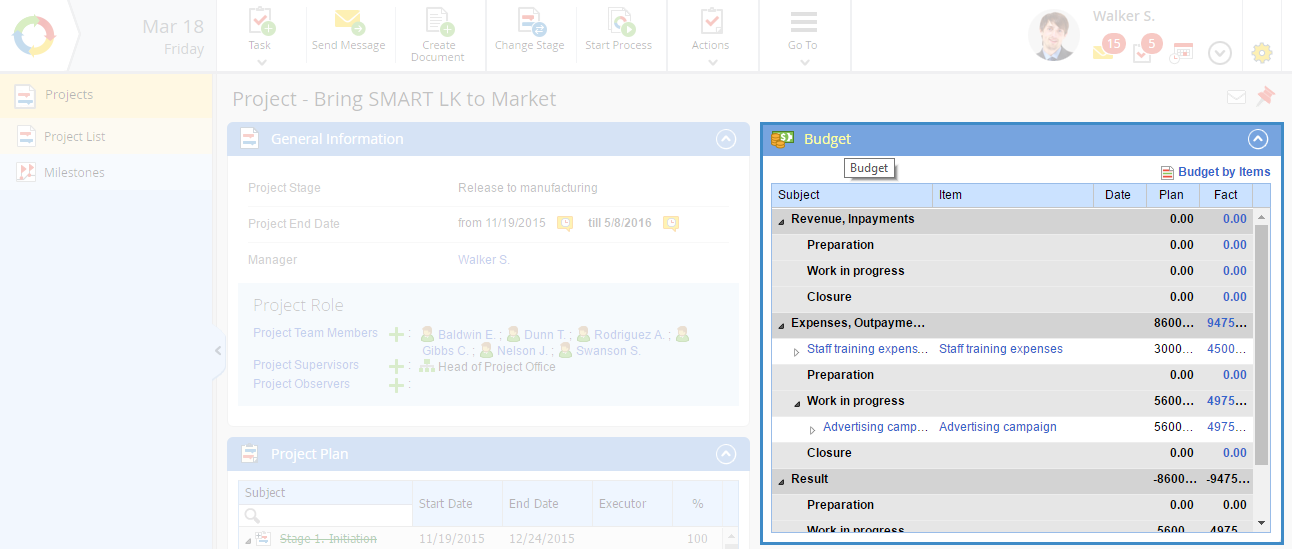
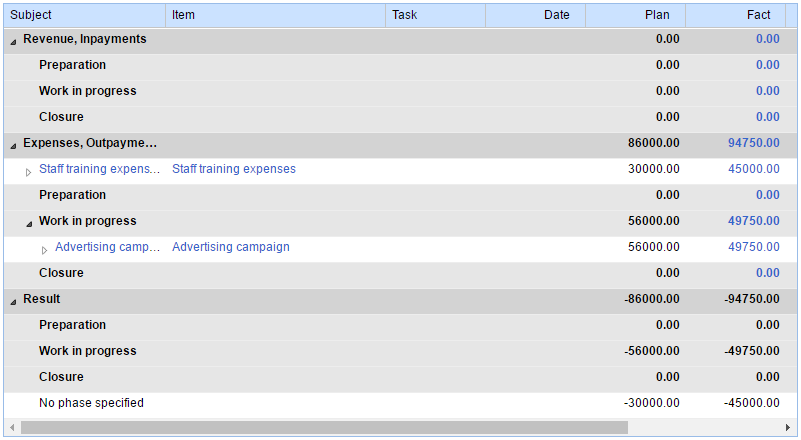
The budget is divided into three groups: "Revenue, inpayments", "Expense, outpayments", "Result". Each group contains the list of project phases. This list depends on the project type.
All the values are in the table (fig. 12), grouped by phases.
Fig. 12. List of planned/fact values of revenues and expenses. Grouping by phases
By default, this table displays:
project phases, used for grouping items. To hide a unit, click , and to show it;
values names. When you click on the name of the required value, a dialog box with the list of fact values of this item;
revenue/expense items, created and configured in the Budget revenue item and Budget expense item objects. When you click on a name of the required item its page in the budget object opens;
fact values – accounted as the project documents (saved to the Financial Documentation folder). When you create a fact value, a Project Revenue/Project Expense document is created. All the data, specified on the fact value creation form are added to the document page;
deviation value and percent (difference between the fact and planned values).
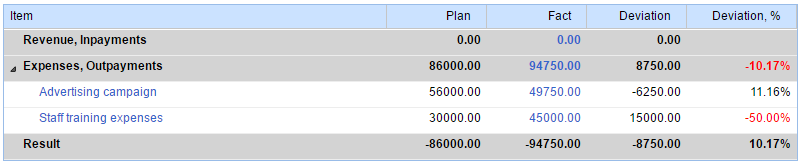
To change the grouping of values in the table, use the toolbar buttons:
When you group data by items, the table looks like this (fig. 13):
Fig. 13. List of planned/fact values of revenues and expenses. Grouping by items
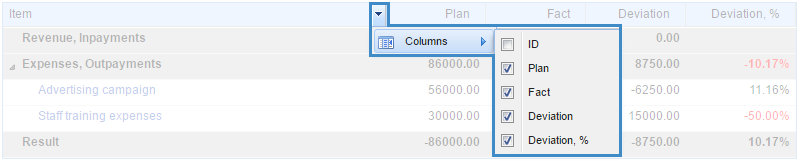
To change the set of columns in the table, mouse over one of the columns and click to open a menu (fig.) for configuring the set of table columns. Check/uncheck the boxes of the required columns.
Fig. 14. Table column settings
Project budget toolbar
Hide/Show the project budget chart. When this button is active, it is highlighted dark yellow. Click on the button to change the display mode.
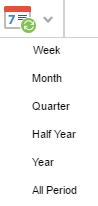
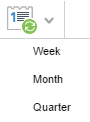
When you click this button, a menu pops up, which allows you to select the period for displaying data on the budget chart: