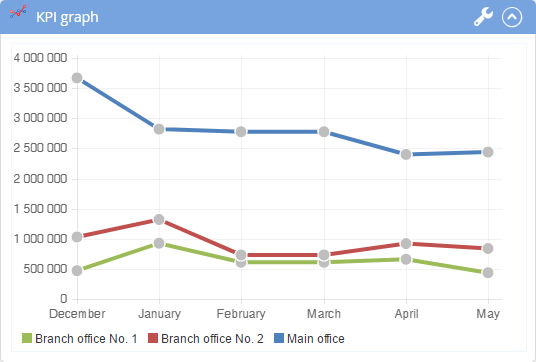
You can use the KPI graph portlet to analyze the dynamics of selected KPI values (fig. 1). In the portlet personal settings, you can select KPIs to display, configure whether to use the previous period, and configure the data display on the bar chart.
Fig. 1. KPI graph portlet
The indicator values on the chart are marked with circles of the color that corresponds to the indicator status over the period.
When you click on a KPI value in the graph, the KPI’s page opens.
Buttons:
– the portlet is expanded. Click this button to collapse the portlet.
– the portlet is collapsed. Click this button to expand the portlet.
– open the portlet settings.
Portlet settings
The settings of this portlet are similar to those of the Bar Chart portlet.