Deal Dynamics is a tool for getting information on the current deal stages, according to the selected sales funnel. It allows displaying information on the number of deals at each stage, and the number of deals successfully/unsuccessfully completed over a selected period.
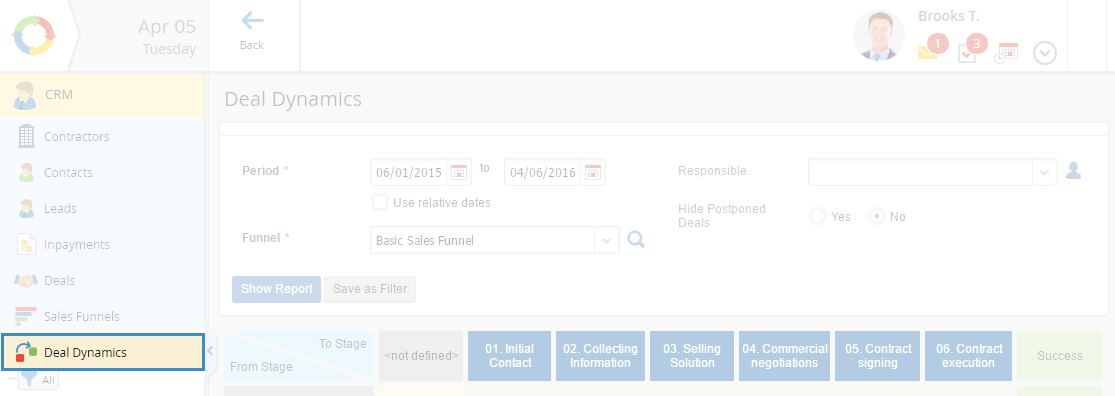
To generate a report, go to CRM – Deal Dynamics (fig. 1).
Fig. 1. CRM – Deal Dynamics
The content of this page can be divided in two parts: report parameters form and the report, generated by these parameters.
This report can be generated, only if there is at least one sales funnel in the system. Otherwise an error message will be displayed: Error forming a report: Sales funnel is not specified.
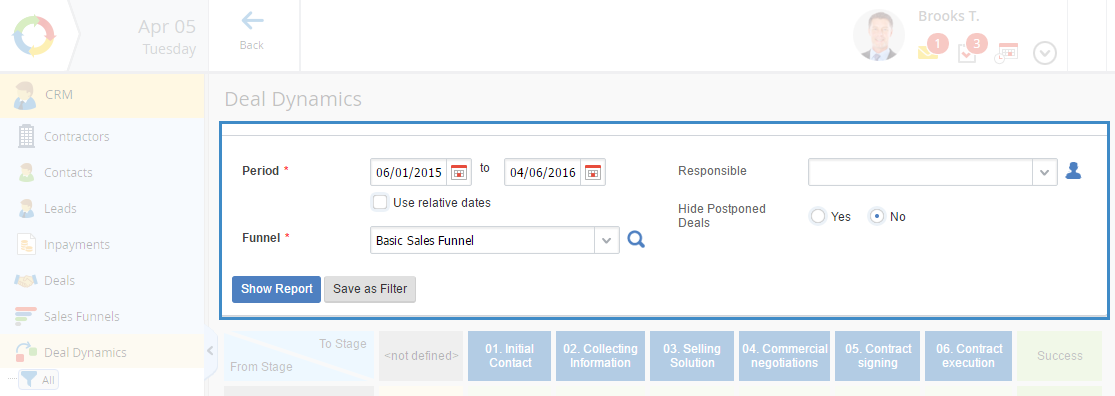
Fill in the required fields on the report parameters form (fig. 2).
Fig. 2. Deal Dynamics form
Funnel *- sales funnel, according to which the report will be generated. To find the required funnel, use the button, to the right of the field, or select the funnel from the drop down list. This field is required.
Responsible – user, responsible for the deals in the current sales funnel. If you leave the field empty, the report will be generated for all the responsible users.
Period *- time period for generating the report. This field is required.
Hide Postponed Deals
Yes – deals with the Postponedstatus will not be displayed in the report;
After filling in the required fields, click Create.
Report Structure
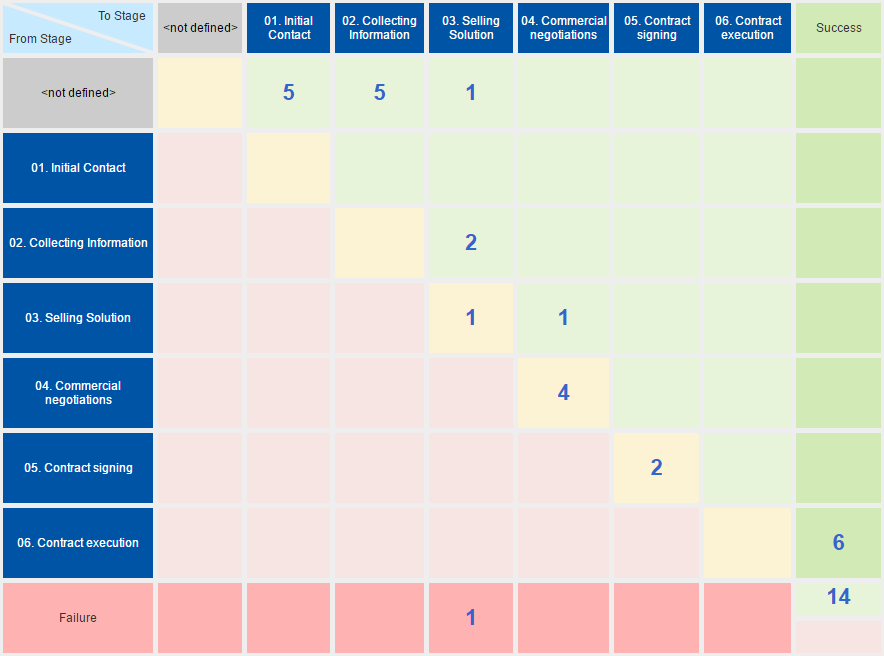
The deals report is displayed as a table. Rows and columns of the table are named as the deal stages of the selected sales funnel. An example of a Deal Dynamics report is shown in fig. 3.
Fig. 3. Deal Dynamics report
Yellow squares display the number of deals, whose stage has not change over the selected period.
The light-green squares above display the number of deals with positive dynamics - the deals, whose stage has changed to the next one during the selected period. The previous stage is in the row name, the current stage is in the column name.
The light-pink squares below display the number of deals with negative dynamics - the deals, whose stage changed to the previous one during the selected period. The previous stage is in the row name, the current stage is in the column name.
The green squares in the last column display the number of successfully closed deals.
The pink squares in the bottom row display the number of failed deals.
The light-green half of the bottom right square displays the total of progressing deals, and the light-pink half displays the total of regressing deals.
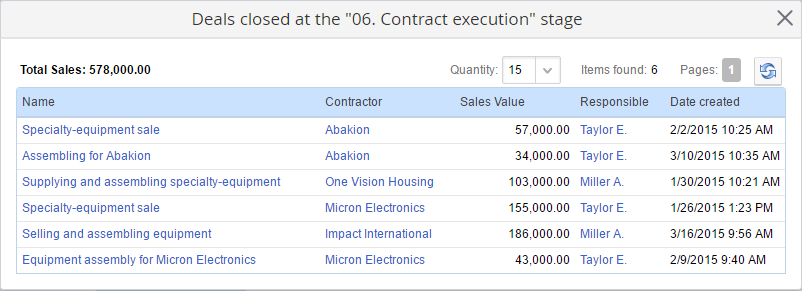
When you click on one of the numbers, a dialog box opens. It displays a table with all the deals in this square (fig. 4).
Fig. 4. Deals table
This table displays the following information on deals: sales sum on current deals, deal name, contractor, sales volume on each sale, user responsible, sale creation date.
Working with this table is similar to working with a standard data table.